
To monitor VMs in Azure means collecting and analyzing different metrics as well as collection log data from system log files and from applications running within the VMs. It is possible to configure an email alert to an administrator which is triggered when certain criteria regarding these metrics are met. Monitoring helps you to gain insight into the status of the VMs.
Windows and Linux VMs collect the following metrics out of the box:
- CPU percentage
- Disk read and write in KB/s or MB/s
- Network in and out in KB/s or MB/s
On Windows, the Azure Virtual Machine Agent installs the IaaSDiagnostics extension which monitors and collects diagnostic data. On Linux the Microsoft.Insights.VMDaignsticsSettings extension provides the same function.
The metrics collected on a Linux VM are:
- CPU
- Disk
- Memory
- Network
- Packets
- Page
- Swap
The metrics collected on a Windows VM are:
- CPU
- Disk
- Network
- Memory
- ASP.NET
- SQL Server
These metrics are stored in Azure Storage Tables. By default, all metrics are collected every minute as a new row in the table.
For Windows VMs, metric data is written to the WADPerformanceCountersTable, with aggregates of these performance counter metrics aggregated to the minute or to the hour written to tables that start with the name WADMetricsPT1M for by minute and WADMetricsPT1H for by hour. In addition to metrics, system logs are also collected. For Linux VM’s, the Syslog is collected into the LinuxsyslogVer2v0 table. For Windows VMs, all event log entries for the three event logs (application, security and system logs) are written to the WADWindowsEventLogsTable.
Windows VMs can collect other types of logs. Diagnostic infrastructure logs (events generated by the Azure Diagnostic Agent, such as issues collecting metrics) are written to the WADDiagnosticInfrastructureLogsTable, and application logs (the trace output from your .NET application running in the VM) are stored in the WADLogsTable. Windows VMs can also collect Event Tracing for Windows Events. These events are collected into the WADETWEventTable. (Source)
Configure monitoring and diagnostics for a new VM
To enable monitoring and diagnostics when deploying a new VM follow these steps:
- Go to the Marketplace, select Compute, then Windows Server, select the desired Version, for example, 2016. After selecting your OS click Create.
- Provide the following information for your VM:
- Name
- Disk type (SSD or HDD)
- User name
- Password
- Subscription
- An existing or new Resource group
- Location
- License (if available)
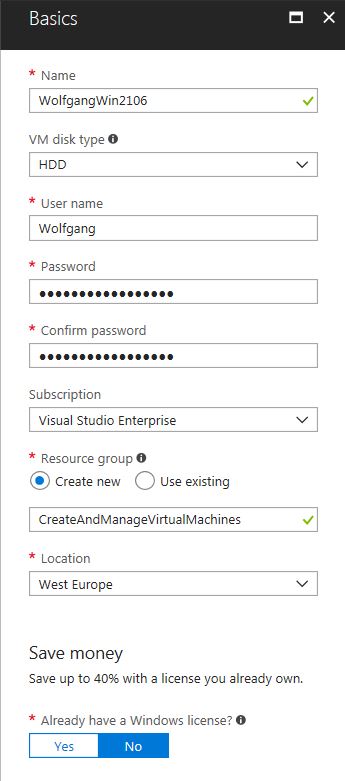
Entering basic data for the new VM
- On the next blade choose a size for your VM. There are many different configurations with different costs to choose from. After you selected one, click Select.
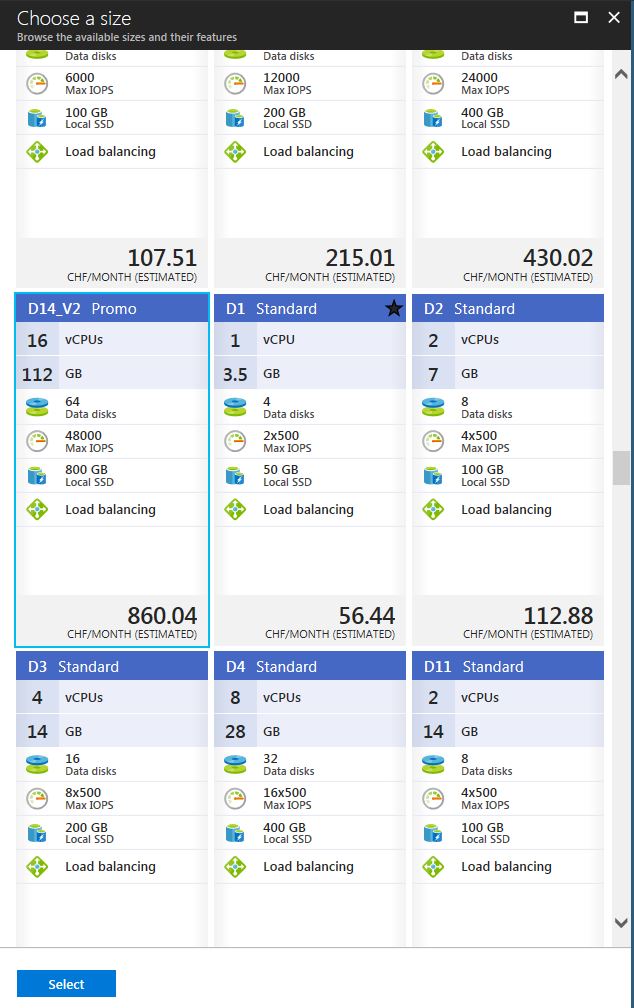
Select a VM size according to your needs
- On the Settings blade, under the Monitoring settings select enabled for Boot diagnostics and Guest OS diagnostics. Select or create a Storage Account where the logs will be stored.
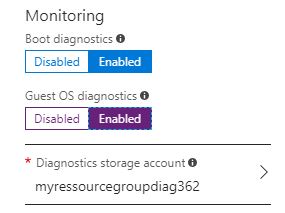
Enable diagnostics when provisioning a VM
- After entering all your settings, you get an overview of them in the Summary blade. Click Create to start the deployment process for your VM.
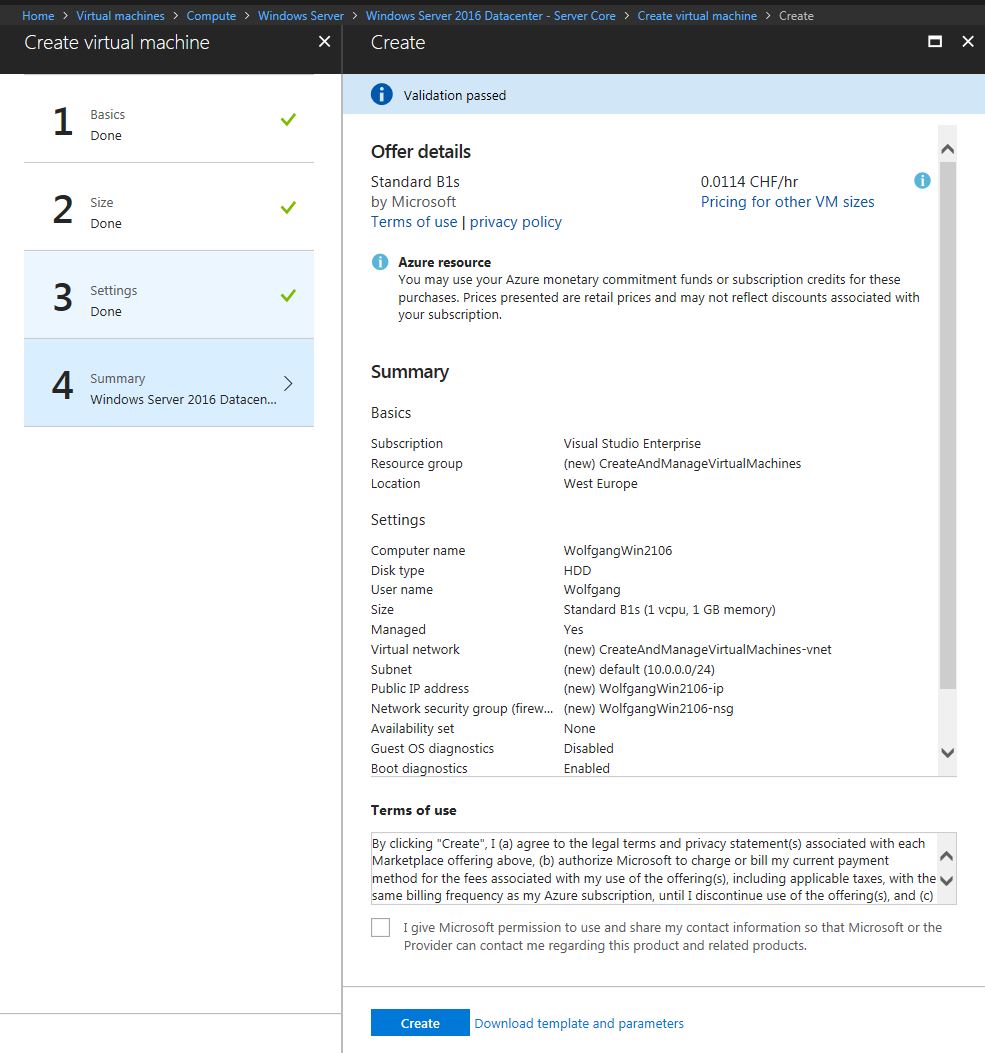
Summary of the new VM
Configure monitoring and diagnostics for an existing VM
To enable monitoring and diagnostics for an existing VM follow these steps:
- Go to your VM in the Azure Portal.
- Under the Monitoring section, select Diagnostics settings.
- For Linux VMs, toggle the Status to On to enable diagnostics.
- For Windows, you have more options
- On the Overview tab, select Enable guest-level monitoring.
- Check the categories you want to log on the Performance counters tab. Additionally, you can set the sample rate in seconds.
- On the Logs tab, you can configure what events the different logs (Application, Security, System, and IIS) log.
- On the Crash dumps tap, you can enable collecting memory dumps during a crash.
- To enable the collection diagnostic infrastructure logs, tootle Diagnostic infrastructure logs to Enabled on the Agent tab. Then select the desired log level.
- After all settings are made, select Save.
Configure Alerts
Azure enables you to configure alert rules based on the collected metrics of your VM. These alerts can be sending an email, invoking a Webhook or run a Logic App. Additionally, it is possible to send an email, an SMS or a Webhook when a specific log event is encountered.
Enable alerts
To enable and configure alerts follow these steps:
- Navigate to your VM in the Azure Portal.
- Under the Monitoring menu, select Alert rules.
- Click + Add metric alert or + Add activity log alert to add a new rule.
- On the Add rule provide a name, select the metric source, specify the condition and then select the action to take when this condition is met.
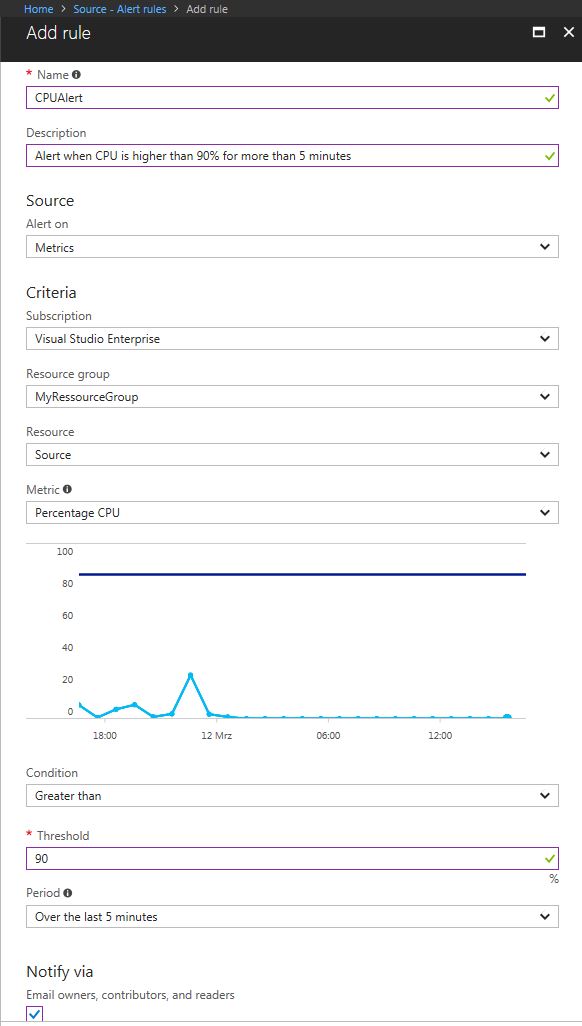
Create a new alert for your VM
- I checked Email owners, contributors and readers to send an email to them. Additionally, you can also enter emails to notify more people.
Monitor metrics
You can assess the status and health of your VM by viewing its metrics in the portal, by querying the table storage for diagnostic logs or by downloading the IIS logs from Azure Storage.
To look at the metrics follow these steps:
- Navigate to your VM in the Azure Portal.
- Select Metrics under the Monitoring menu.
- On the Metrics blade, select the metrics you want to view. The selected metrics will be displayed as a graph on the right side.
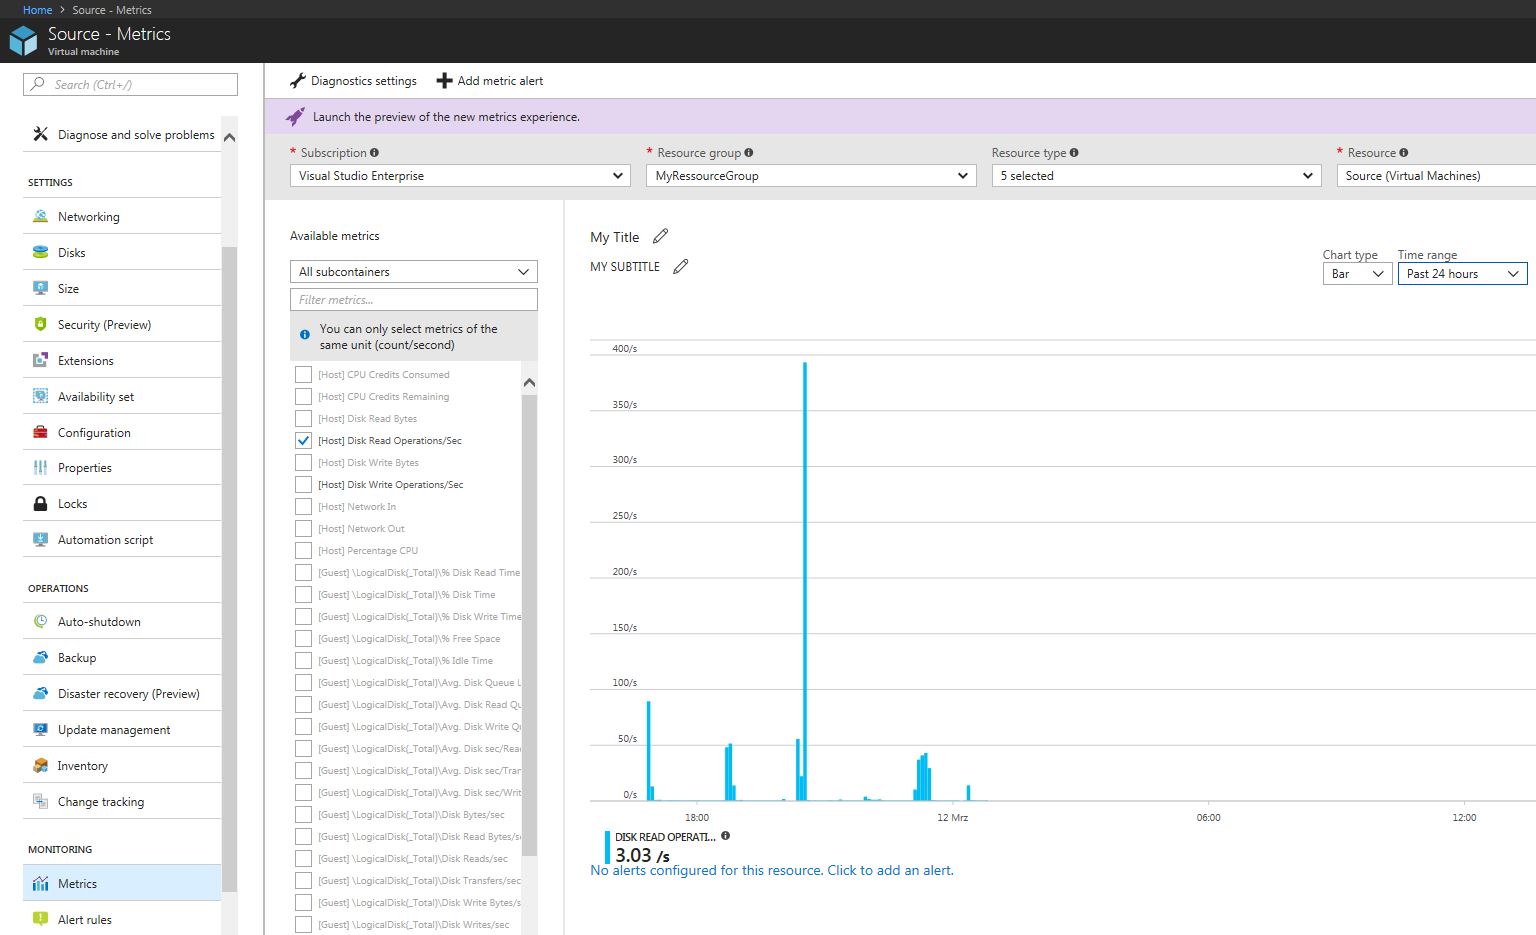
View the desired metrics
- You can add a title and subtitle on the top of the graph and change the time range on the right side.
View event logs, diagnostic infrastructure logs and application logs
You can view event logs, diagnostic infrastructure logs and application logs by querying the respective tables WADWindowsEventLogsTable, WADDiagnosticInfrastructureLogsTable, WADLogsTable). This can be easily done using Visual Studio:
- Open Visual Studio
- On the View menu, click Cloud (or Server) Explorer.
- Expand the Azure node, then the Storage node.
- Expand the storage account which contains the logs you want to view. Then expand Tables.
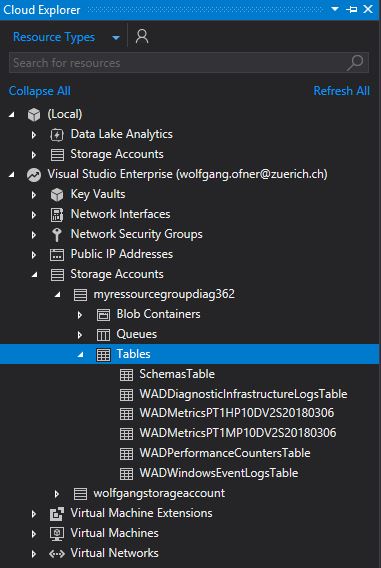
Select a log using Visual Studio
- Right-click on the table you want to query and selectOpen to display its contents.
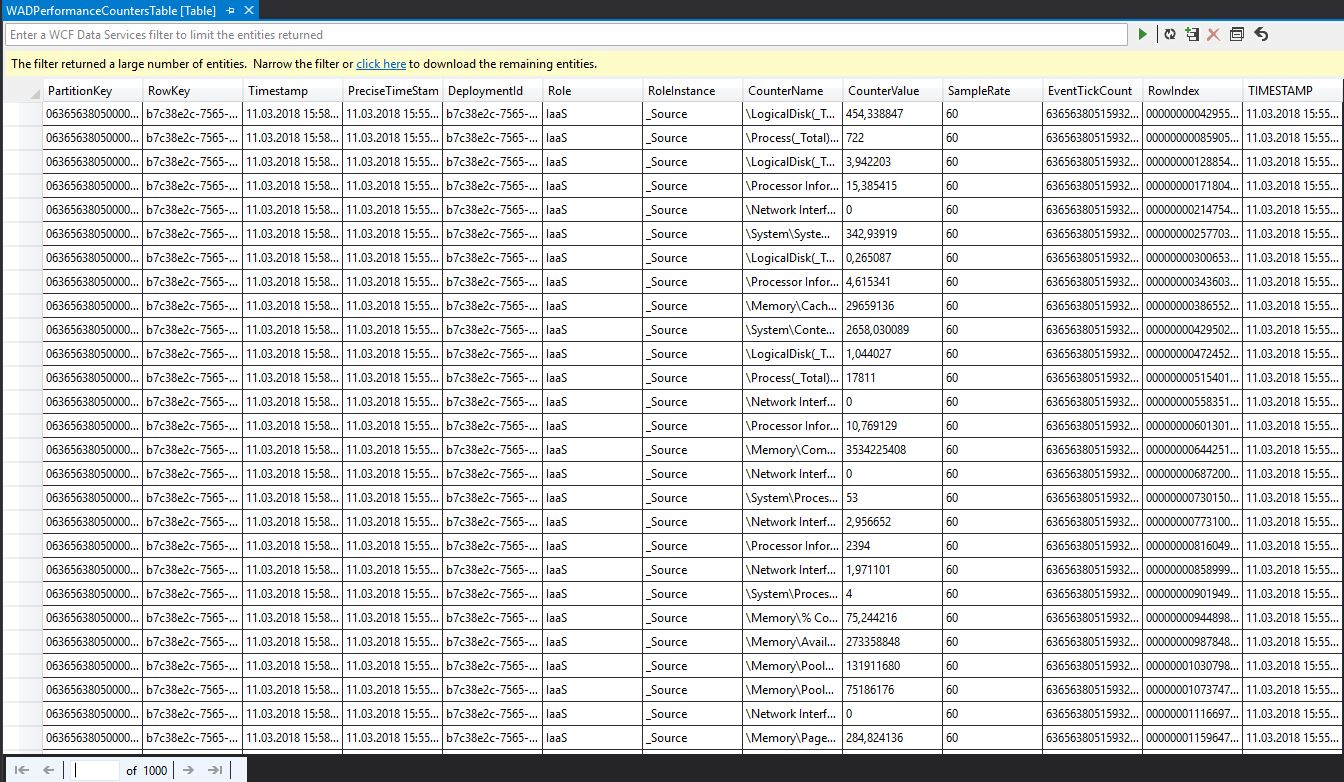
The queried logs in Visual Studio
View IIS logs
To view IIS logs using Visual Studio follow these steps:
- Open Visual Studio
- On the View menu, click Server Explorer.
- Expand the Azure node, then the Storage node. If you can’t see your storage account there right-click and select Attach external storage. In the new window, enter the name and key for your storage account.
- Expand the storage account which contains the logs you want to view. Then expand Blobs.
- If you don’t see the logs, go to your VM, select Diagnostic settings and on the Logs blade enable IIS logs.
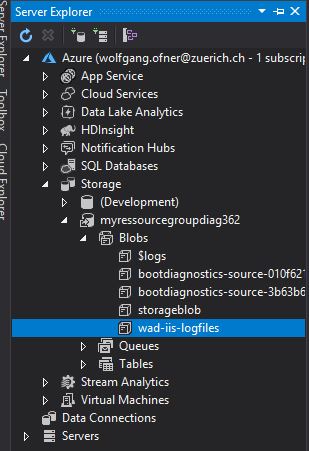
Open the IIS log using Visual Studio
- Right-click on wad-iis-logfiles and select view Blob container. There you can view or download the IIS logs.
View Boot diagnostics
To view the boot diagnostics follow these steps:
- Open your VM in the Azure Portal.
- Select Boot diagnostics from the Support + Troubleshooting menu.
- If you have a Windows VM, you see the login screen. Select Serial log to see and download the log file. If you have a Linux VM, you will see the log by default.
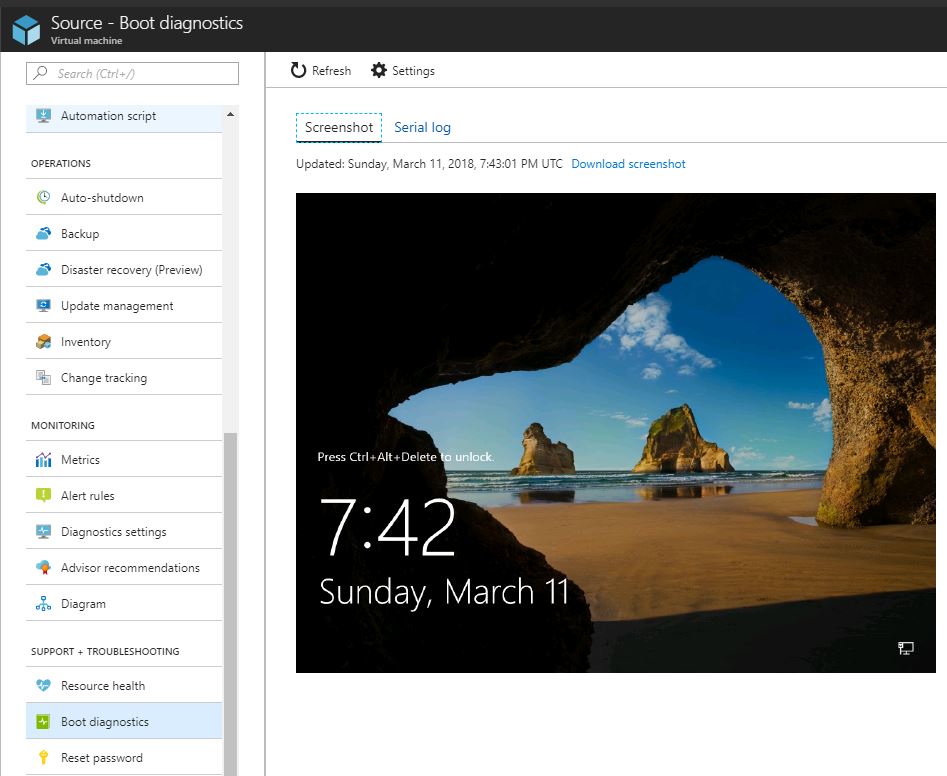
View Boot diagnostics
Enable Application Insights at runtime
To enable Application Insights at runtime, you first have to create a new Application Insights instance. You can do that following these steps:
- Go to the marketplace in the Azure Portal.
- Search for Application Insights and click Create.
- Provide a new, Subscription, Resource Group and Location. Leave the Application Type as ASP.NET web application.
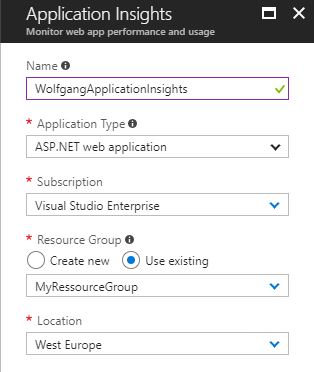
Create a new Application Insights instance
- Go to your WebApp, which you want to monitor.
- Select Application Insights under the Monitoring menu.
- On the Application Insights blade, click Select existing resource and then click on your previously created Application Insights instance.
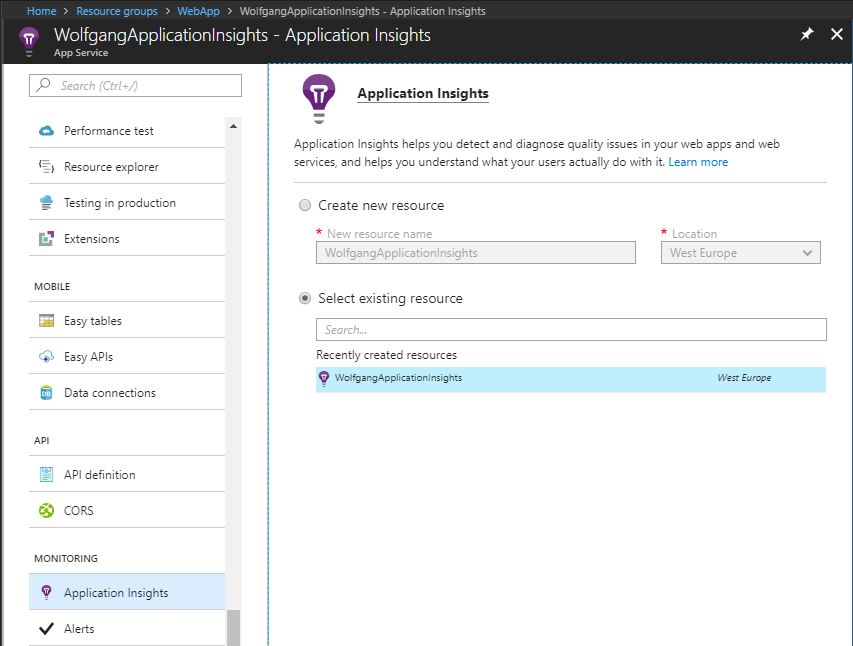
Enable Application Insights for your WebApp
- Click on OK.
- Visit your WebApp and after a couple moments, you will see live information about your WebApp.
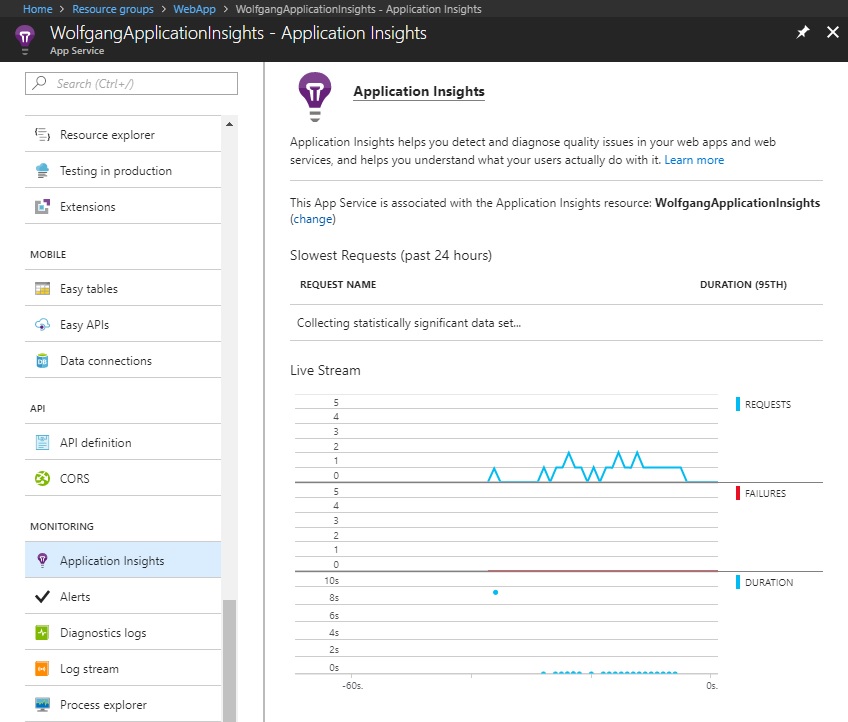
Get Live Stream information from Application Insights
Monitor VM workloads by using Azure Application Insights
To monitor a VM workload with Azure Application Insights follow these steps:
- Open the IIS web server on your VM.
- Download and install the Status Monitor.
- After the Status Monitor is installed, open IIS and select the web application that you want to monitor.
- Sign in with your Azure credentials and click on Configure settings to configure to which Application Insights you stream your data.
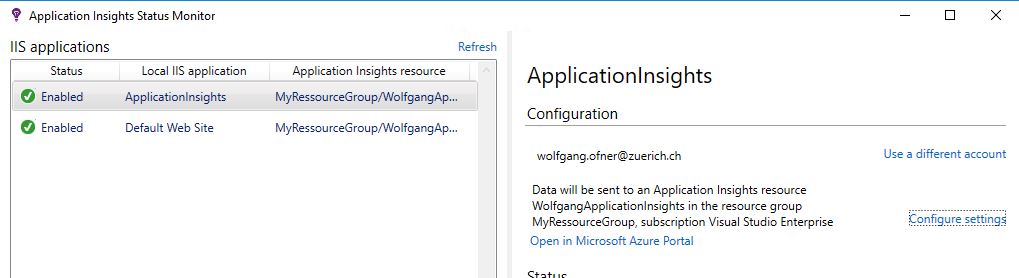
Enable Application Insights Status Monitor on your VM
- After you configured the settings, the web application will start streaming its information to the selected Application Insights application.
- To view these information, go to the Azure Portal and open your Application Insights instance.
- Select Live Metrics under the Investigate menu.
- You will see a live stream of incoming and outgoing requests, failures and the duration of the requests.
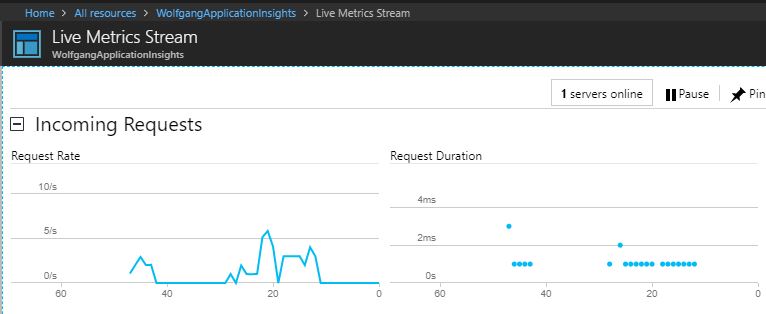
Live Metrics in Application Insights from the Web Application running on IIS on the VM
Monitor VMs using Azure Log Analytics and OMS
With Azure Log Analytics, you can collect data directly from your Azure VM and other resources in your environments into a single repository for detailed analysis. To set up Azure Log Analytics follow these steps:
- In the Azure Portal, go to the Marketplace and search for Log Analytics.
- Select Log Analytics and click Create.
- Provide a name, Subscription, Resource Group, Location, and Pricing tier, then click OK.
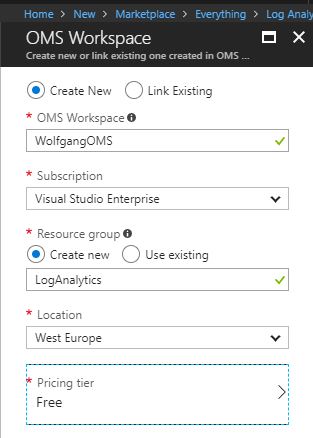
Create a new Log Analytics instance
Enable the Log Analytics VM Extension
After Log Analytics is created, you have to enable the Log Analytics VM Extension. The extension gets installed automatically and configures the agent to send data to the Log Analytics automatically. To set enable the Log Analytics VM Extension follow these steps:
- Go to your Log Analytics in the Azure Portal.
- Select Virtual machines under the Workspace Data Sources menu and select the VM you want to install the agent on.
- On the Virtual machine blade, click on Connect. This installs the agent and configures it for your Log Analytics workspace.
- After the installation is completed, the OMS connection status will change to This workspace.
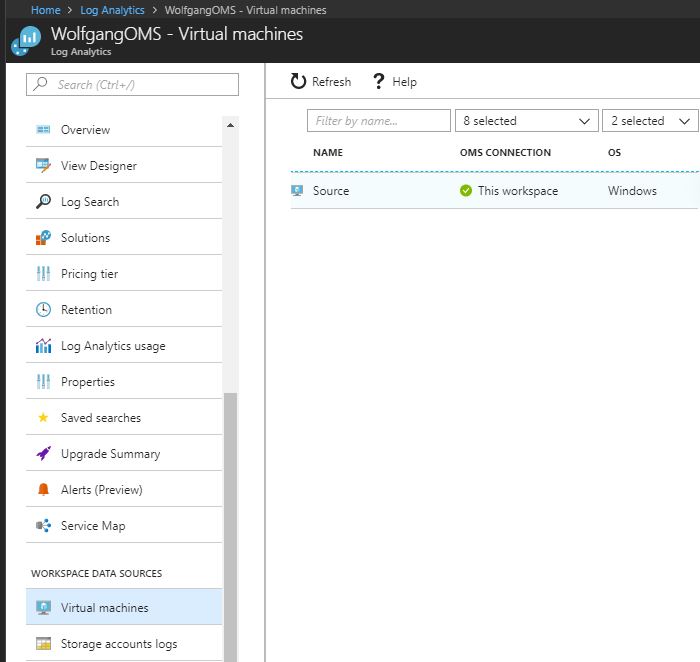
Installing the agent on your VM
Collect event and performance data
Log Analytics can collect events from the Windows event logs or Linux Syslog and performance and also take action when a particular condition is detected. To set it up, follow these steps:
- Go to Log Analytics in the Azure Portal.
- Select Advanced settings under the Settings menu.
- Select Data and then select Windows Event Logs.
- Add a new event log by entering a name and then clicking +.
- After the log is created, select the desired log level.
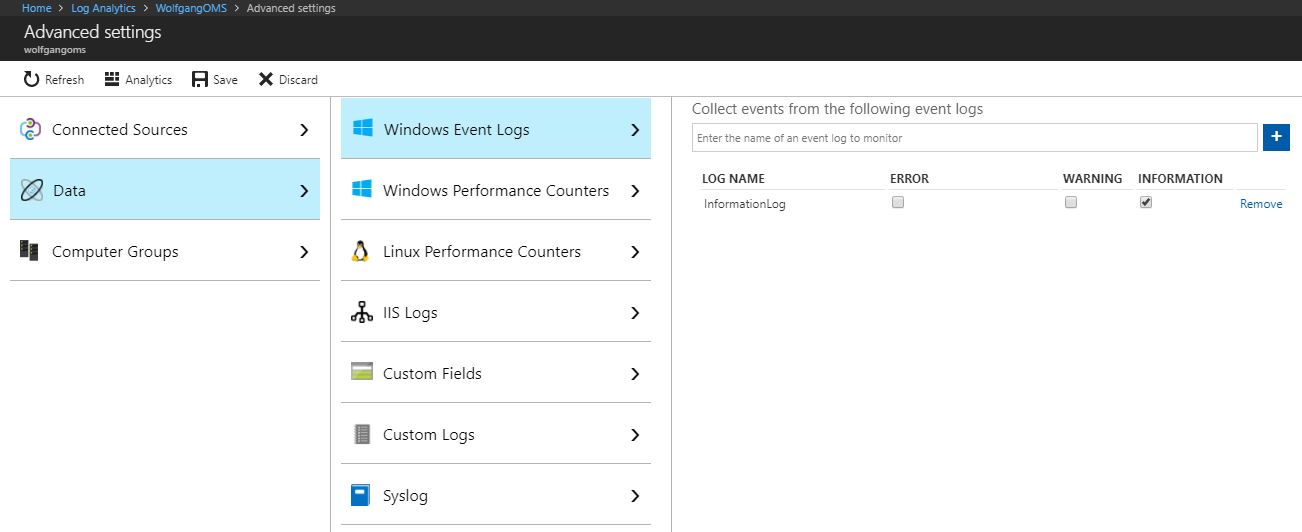
Create a new Log for information from your VM
- Select Windows Performance Counters and enable your desired performance counters.
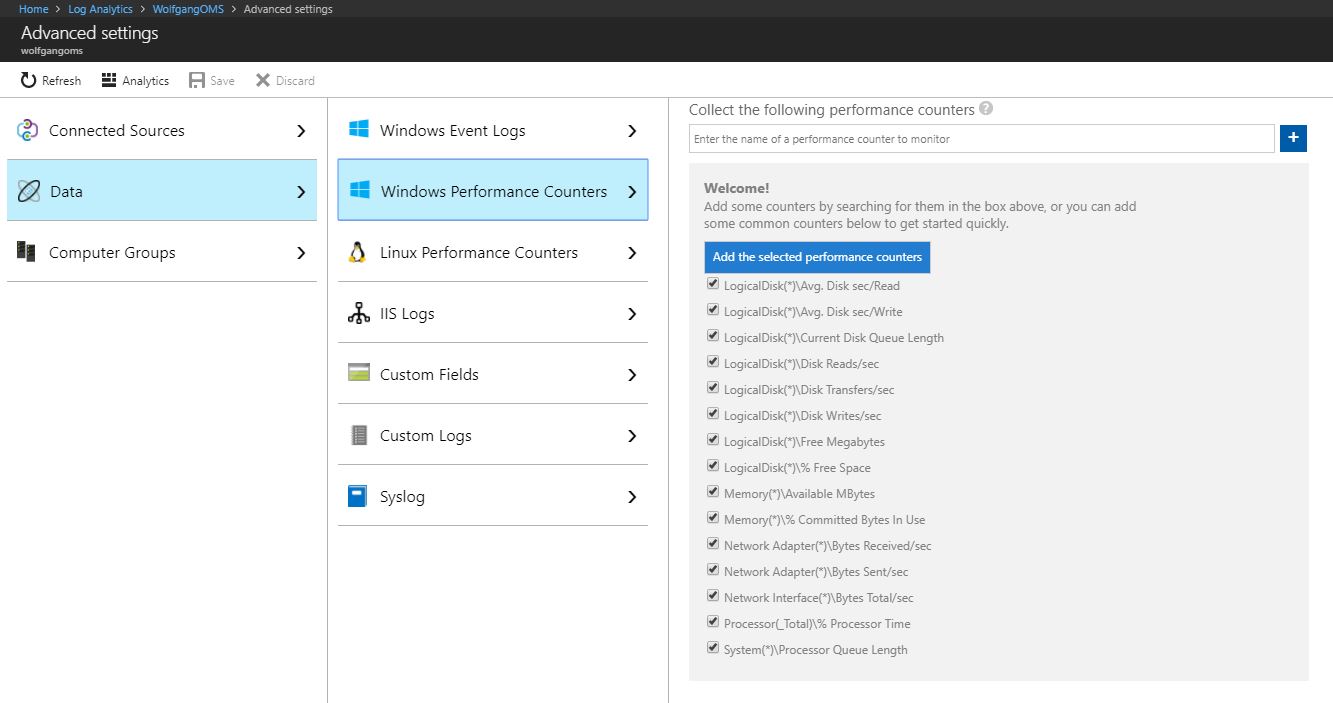
Select your desired performance counters
- Click Save.
View the collected data
After data collection is set up, you can run searches in your log. To do that, follow these steps:
- Open your Log Analytics in the Azure Portal.
- Click Log Search under the General menu.
- The Log Search blade already suggests a couple of queries and the search box also makes suggestions based on your input. For example, you could enter Usage and click the Search icon which will give you various information about the usage of your VM.
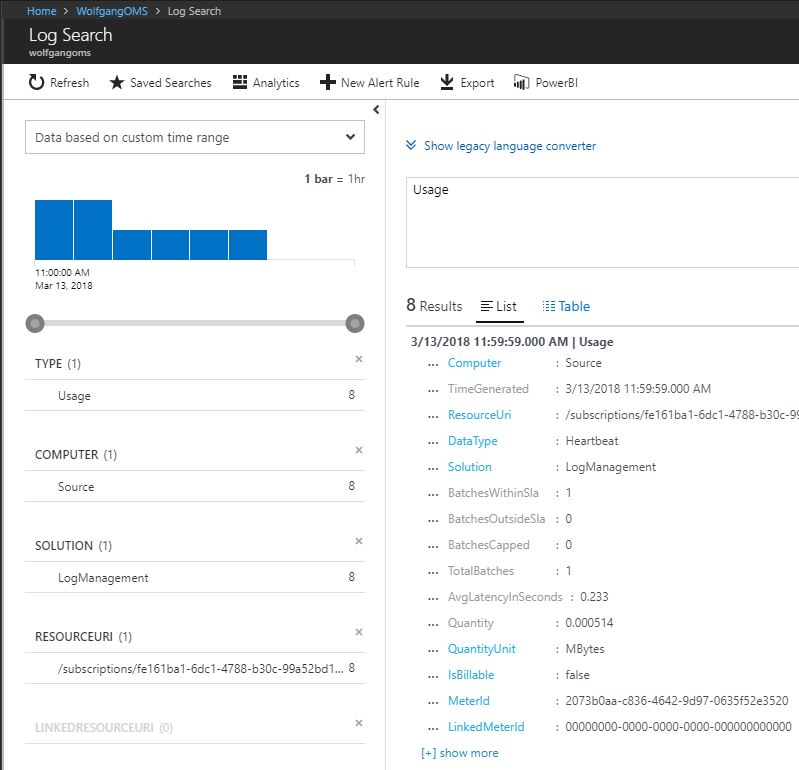
Search the logs for the usage of your VM
Monitor your network topology
After you deployed your Network Watcher, you can look at the topology of your network by following these steps:
- Click on Topology under the Monitoring menu.
- On the Topology blade select your Subscription, Resource group, and Virtual Network.
- Your network will be displayed you can download it by clicking on Download topology
Monitor your network
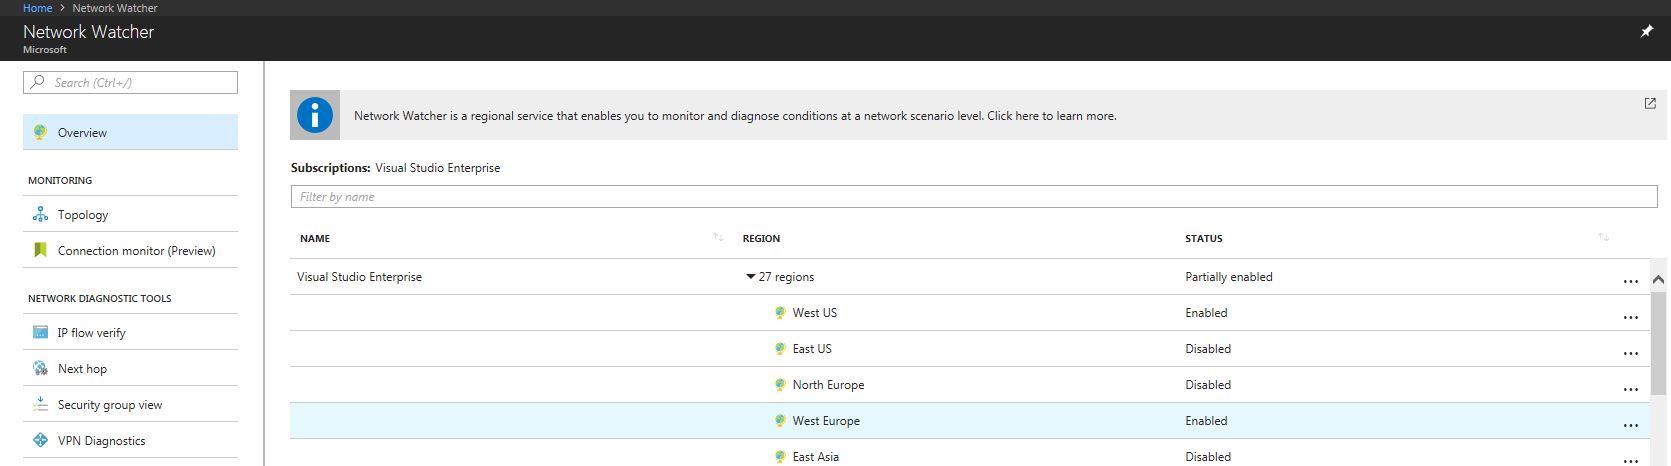
To monitor and diagnose your network, Azure has a service called Network Watcher. The Network Watcher can visualize your network and therefore can help you to understand, diagnose and gain insights into your network in Azure. Following, I will talk about some features of the Network Watcher.
Create a Network Watcher
To enable a Network Watcher follow these steps:
- In the Azure Portal, click on All services and search for Network Watcher and select the result.
- On the Overview blade of your Network Watcher, enable the regions you want to monitor in the drop-down list.
Enable Network Watchers in your desired location
Monitor the topology of your network
After your Network Watcher is deployed, you can take a look at the topology of your network. To do that follow these steps:
- In your Network Watcher, click on Topology under the Monitoring menu.
- On the Topology blade, select a Subscription, Resource Group, and a Virtual Network.
- After a couple of seconds, your network will be displayed. You can also download the topology by clicking on Download topology.
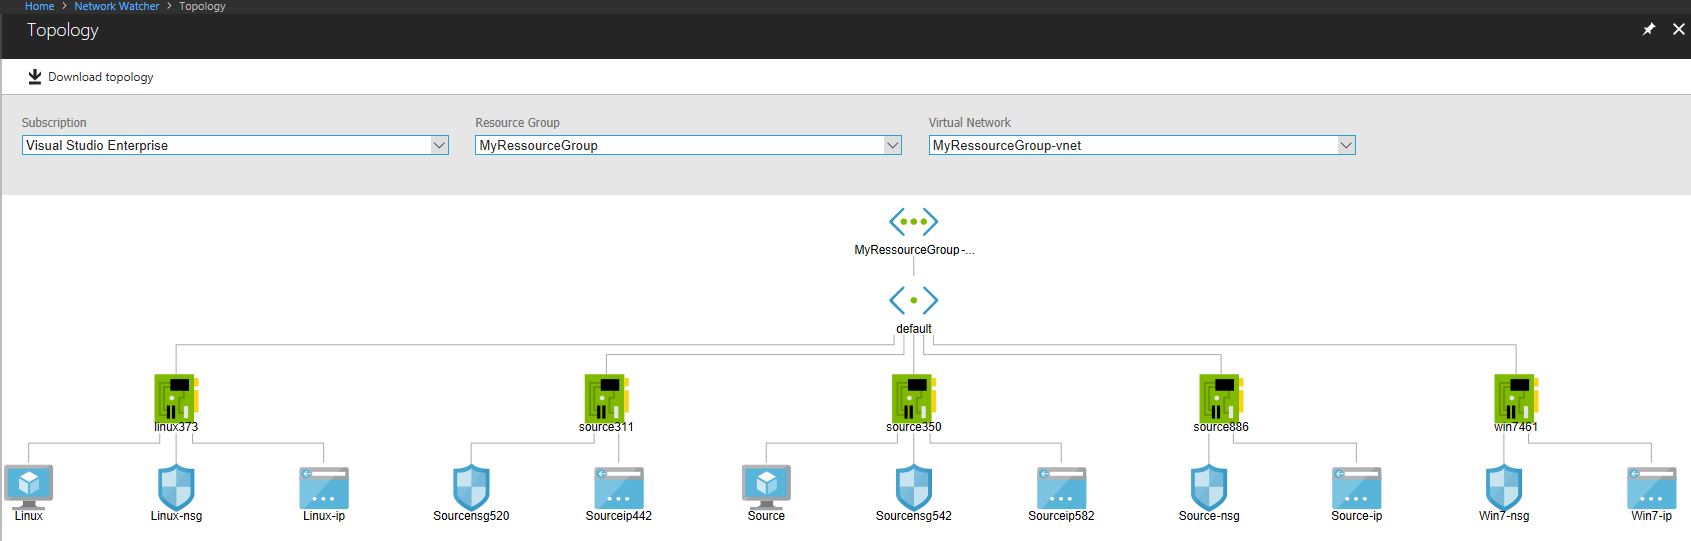
Topology with virtual machines and network cards
Monitor your network limits
You can only have a certain amount of network resources per subscription. The Network Watcher lists all used resources and makes it easy to monitor them. To do that follow these steps:
- In your Network Watcher, click on Network subscription limit.
- Select a Subscription and Location.
- The Portal will list all resources, the current limit, and your usage.
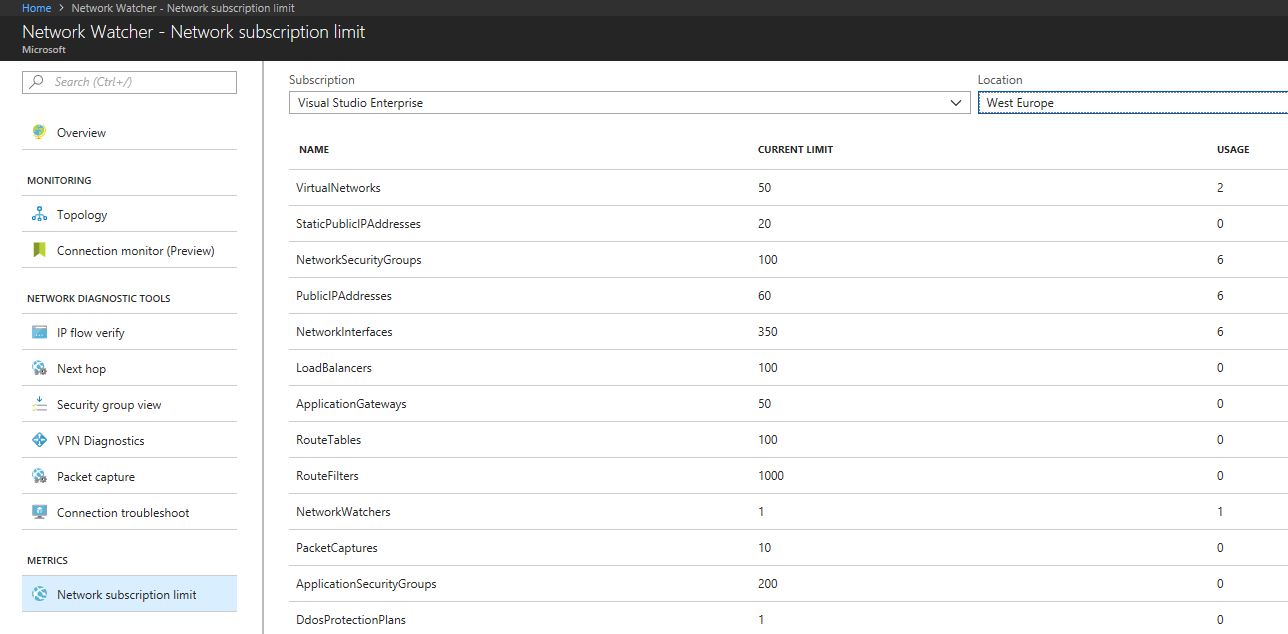
Overview of the Network subscription limit
Conclusion
In this post, I showed how to enable monitoring and diagnostics when deploying a new VM as well as for an existing VM. The next section talked about Application Insights and how to monitor WebApps and also application running on IIS on a VM. Next, I showed how to monitor your VMs with Log Analytics and how to filter these logs. The last part was a short overview of the Network Watcher and how to monitor your network with it.
For more information about the 70-532 exam get the Exam Ref book from Microsoft and continue reading my blog posts. I am covering all topics needed to pass the exam. You can find an overview of all posts related to the 70-532 exam here.
Comments powered by Disqus.