
DevOps is a combination of development (Dev) and Operations (Ops). The ultimate goal of DevOps is automation and repeatability which allows for increased deployment frequency without the burden that manual deployments bring.
Instrument an application with telemetry
Application Insights is an extensible analytics service for application developers on multiple platforms that helps you understand the performance and usage of your live applications. With it, you can monitor your web application, collect custom telemetry, automatically detect performance anomalies, and use its powerful analytics tools to help you diagnose issues and understand what users do with your app. It works with web applications hosted on Azure, on-premise, or in another cloud provider.
To get started, you only need to provision an Application Insights resource in Azure, and then install a small package in your application. The things can instrument are not limited just to the web application, but also any background components, and JavaScript within its web pages. You can also pull telemetry from host environments, such as performance counters, Dicker logs, or Azure diagnostics.
The following telemetry can be collected from server web apps:
- HTTP requests
- Dependencies such as calls to SQL Databases, HTTP calls to external services, Azure Cosmos DB
- Exceptions and stack traces
- Performance Counters, if you use Status Monitor, Azure monitoring or the Application Insights collected writer
The following telemetry can be collected from client web pages:
- Page view counts
- AJAX calls requests made from a running script
- Page view load data
- User and session counters
- Authenticated user IDs
The standard telemetry modules that run out of the box when using the Application Insights SDK send load, performance and usage metrics, exception reports, client information such as IP address, and calls to external services.
Discover application performance issues by using Application Insights
System performances depends on several factors. Each factor is typically measured through key performance indicators (KPIs), such as the number of database transactions per second or the volume of network requests.
Application Insights can help you quickly identify any application failures. It also tells you about any performance issues and exceptions.
When you open any Application Insights resource you see basic performance data on the overview blade. Clicking on any of the charts allows you to drill down into the related data to see more detail and related requests, as well as viewing different time ranges.
If your application is built on ASP.NET or ASP.NET Core, you can turn on Application Insight’s profiling to view detailed profiles of live requests. In addition to displaying hot paths that are using the most response times, the Profiler shows which lines in the application code slowed down performance.
To enable the Profiler, follow these steps:
- In your Application Insights resource, select the Performance blade and select Profiler.
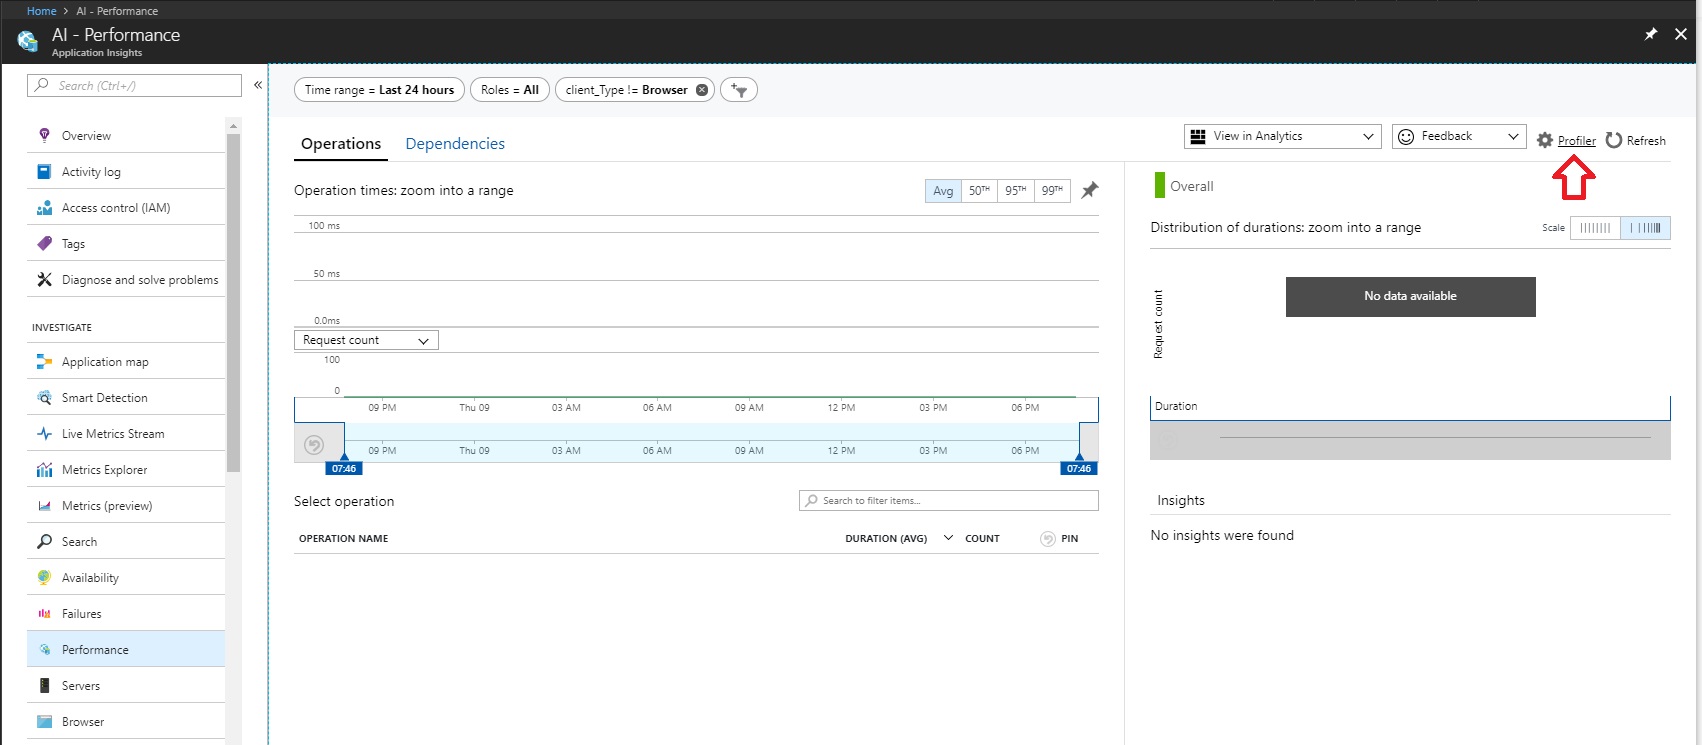
Create a Profiler
- Select Add Linked Apps from the top of the Configure Application Insights Profiler blade.
- Select the application you wish to link to see all its available slots. Click Add to link them to your Application Insights resource.
- After linking, select Enable Profiler from the of the Configure Application Insights Profiler blade.
Deploy Visual Studio Team Services with Continuous Integration (CI) and Continuous Delivery (CD)
Continuous Integration is a practice by which the development team members integrate their work frequently, usually daily. An automated build verifies each integration, typically along with tests to detect integration errors quickly, while it’s easier and less costly to fix them. The output, or artifacts, generated by the CI systems are fed to the release pipeline to streamline and enable frequent deployments.
Continuous Delivery is a process where the full software delivery lifecycle is automated including tests, and deployment to one or more test and production environments. Azure App Services supports deployment slots, into which you can deploy development, staging, and production builds from the CD process. Automated release pipelines consume the artifacts that the CI systems produce, and deploys them as new version and fixes to existing systems.
Your source code must be hosted in a version control system. VSTS provides GIT and Team Foundation Version Control. Additionally, GitHub, Subversion, Bitbucket, or any other Git repository can be integrated with the Build service.
To configure the CI/CD pipeline from the Azure portal, follow these steps:
- In the Azure portal click on +Create a resource, search for Web App and click Create.
- Provide a name, subscription and APP Service plan.
- Click Create.
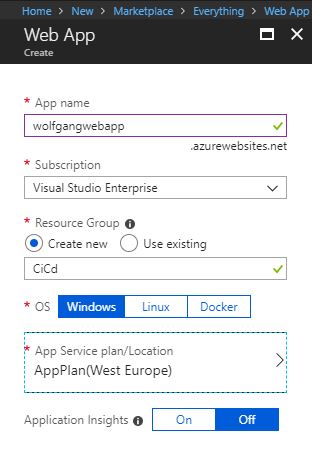
Create a new Web App
- After the web app is deployed, open it in the Azure portal and select the Deployment Center blade under the Deployment menu.
- Select VSTS and then click Continue.
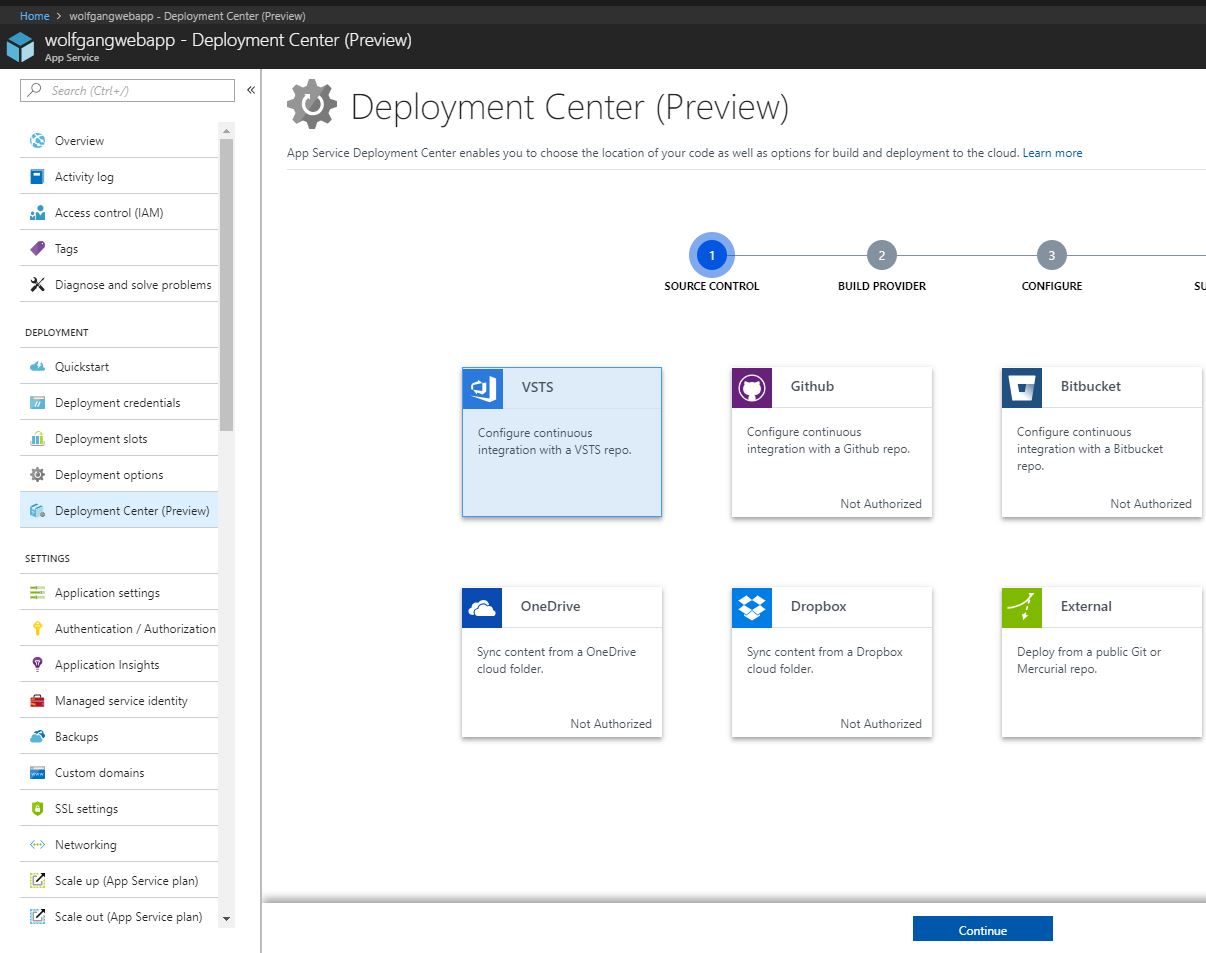
Create Continuous Delivery with VSTS
- On the next page, select App Service Kudu as your build server and click Continue.
- Provide your VSTS Account, select a project, repository, and branch you want to use for the deployment and click Continue.
- After everything is set up, Azure Continuous Delivery executes the build and initiates the deployment.
Deploy CI/CD with third-party platform DevOps tools (Jenkins, GitHub, Chef, Puppet, TeamCity)
Azure allows you to continuously integrate and deploy with any of the leading DevOps tools, targeting any Azure service.
Out of the box, Azure App Services integrates with source code repositories such as GitHub to enable a continuous DevOps workflow.
Follow these steps to enable continuous deployment from a GitHub repository:
- Publish your application source code to GitHub.
- In the Azure portal, open your web app and select Deployment options under the Deployment menu.
- On the Deployment option blade, select GitHub, authorize Azure to use GitHub, select a project and a branch.
- Click OK.
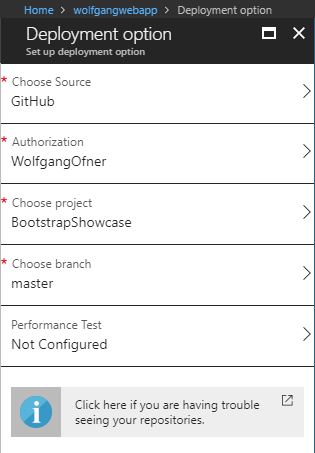
Enable continuous deployment from GitHub
When you push a change to your repository, your app is automatically updated with the latest changes.
Conclusion
This post gave a short overview of how to use various tools in Azure to implement DevOps. DevOps is a mix of Development and Operations and should help to deploy faster and with fewer errors due to automation. Azure supports different DevOps tools like VSTS or GitHub.
For more information about the 70-532 exam get the Exam Ref book from Microsoft and continue reading my blog posts. I am covering all topics needed to pass the exam. You can find an overview of all posts related to the 70-532 exam here.
Comments powered by Disqus.