

In my last post, I added the Prometheus client library to my .NET microservices. This was the first step to implementing monitoring of the microservices which are running in a Kubernetes cluster.
In this post, I will show you how to create your first dashboard with Grafana using the Prometheus data.
This post is part of “Microservice Series - From Zero to Hero”.
Add the Microservices to the Prometheus Configuration for Scrapping
You can find the code of the demo on GitHub.
You have to add the microservices as targets in Prometheus before you can visualize their Prometheus data. I installed Grafana Loki in a previous post which also installs Prometheus. You can find the details in Collect and Query your Kubernetes Cluster Logs with Grafana Loki.
After you have installed Prometheus, open the configuration of the Prometheus server. You can use a Kubernetes dashboard and edit the yaml file in your browser. In Azure Kubernetes Service - Getting Started I explain how to use Octant as a dashboard to access your Kubernetes cluster.
Open the dashboard and then select the namespace where you have installed Prometheus. If you followed this series, the namespace is loki-grafana. Navigate to the Config Maps and there you can find the configuration for the Prometheus server named loki-prometheus-server.
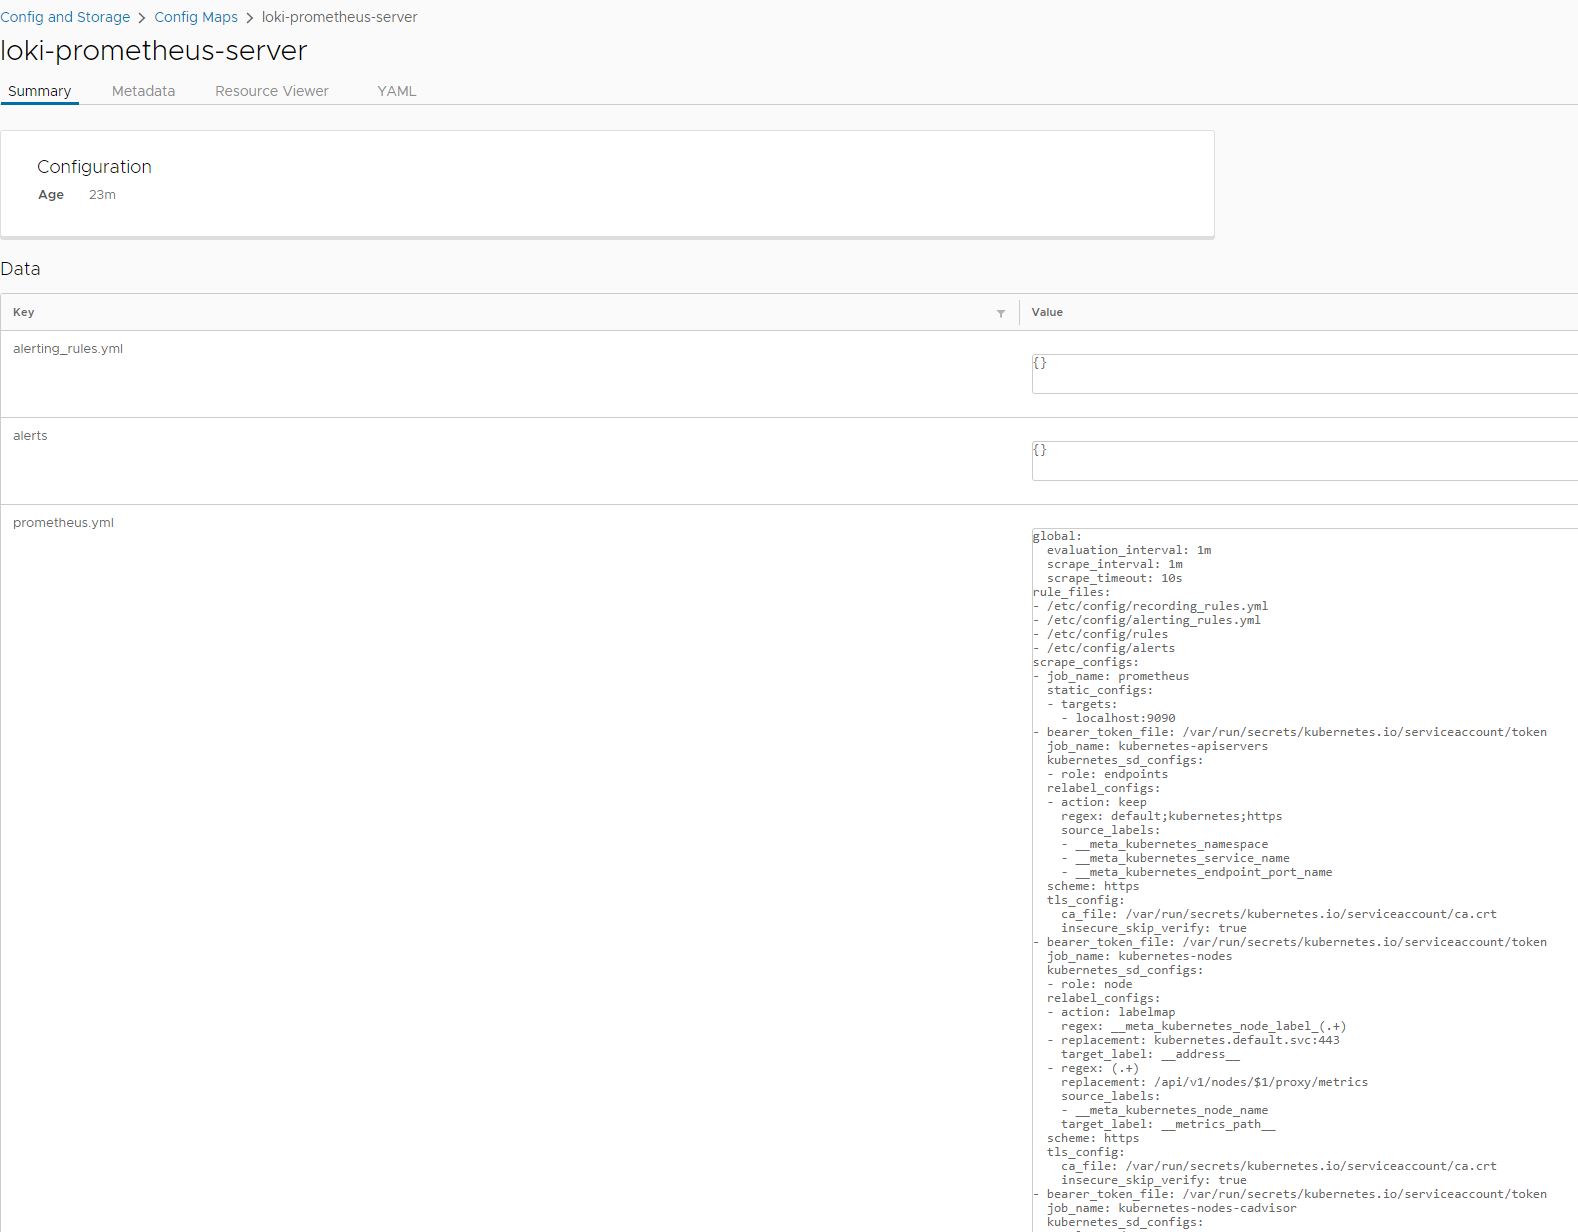
Edit the Prometheus Configuration
Select the YAML tab and add the following code under scrape_configs:
This tells Prometheus to scrape data from a pod in the customer-api namespace. The pod has the label app=customerapi and the Prometheus data is available under /metrics. Save the config and then let’s check if customerapi is available in Prometheus.
Inspect the Prometheus Scrap Targets
In the Kubernetes dashboard, navigate to the loki-grafana namespace and select the loki-prometheus-server pod. There you can activate the port forwarding to access the pod from your computer.
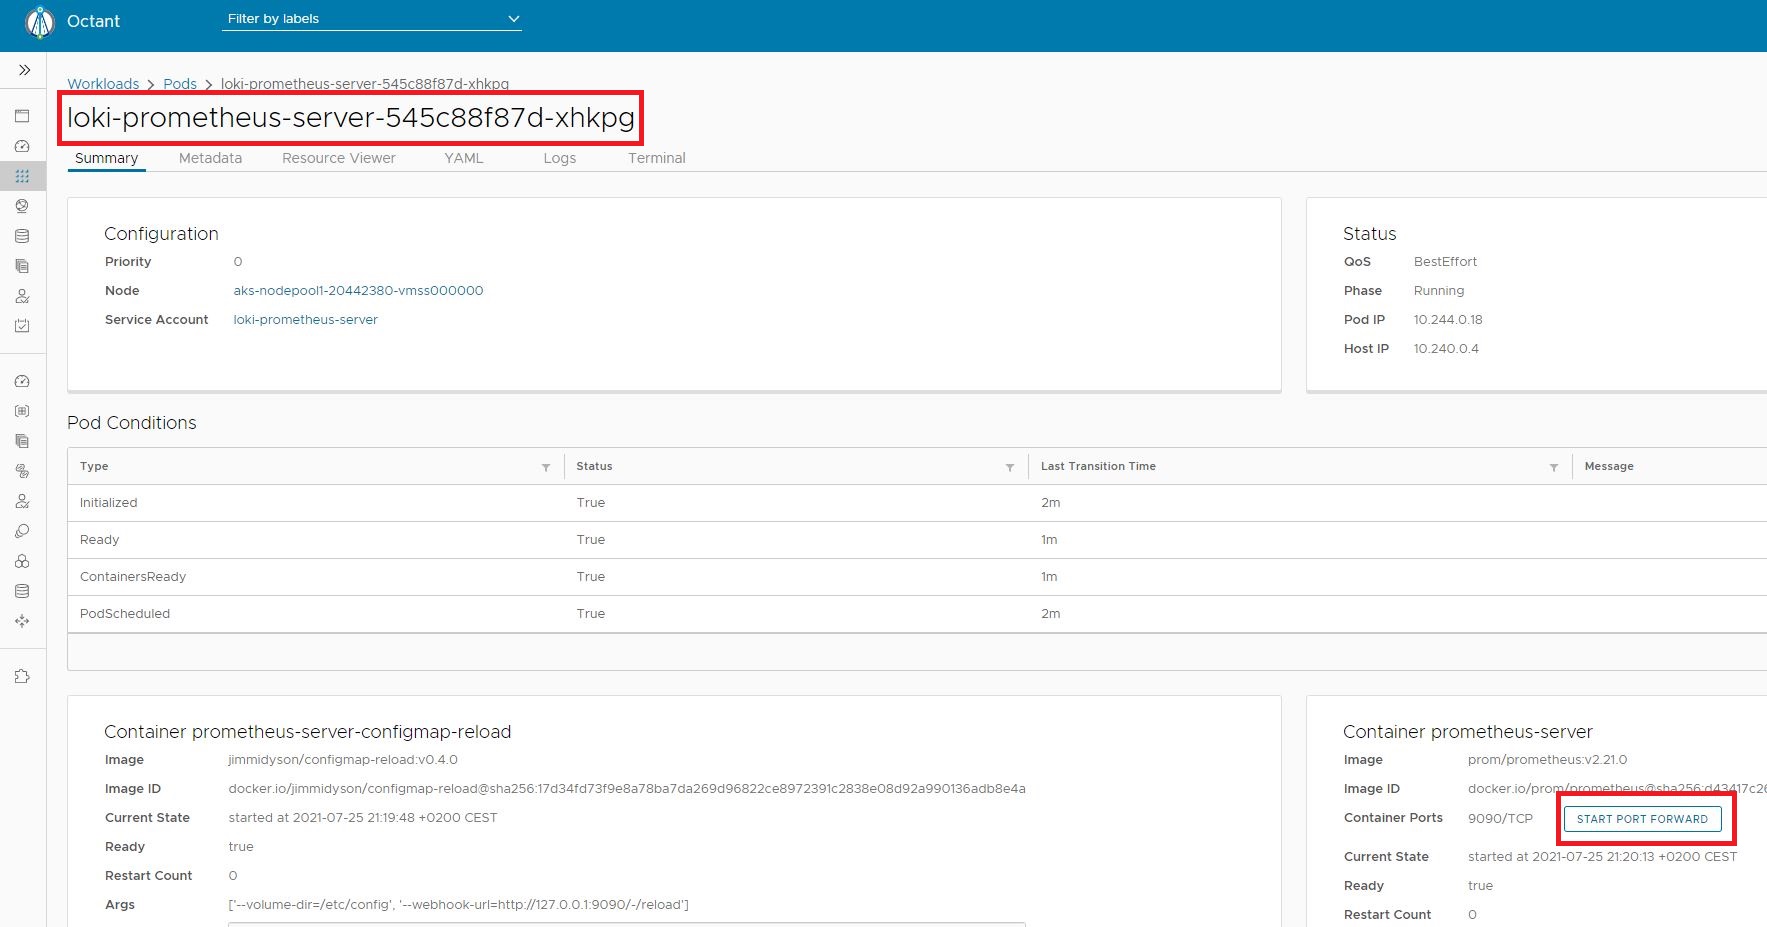
Open the Prometheus Server Pod in the Dashboard
Click the button Start Forwarding and you will get a localhost URL that forwards your request to the Prometheus server instance. The URL in my case is http://localhost:53625.
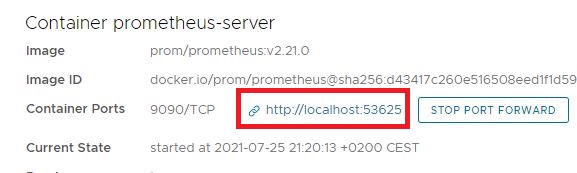
Activate the Port Forwarding
Open the URL and navigate to /targets. There you should see the customerapi-test target as healthy. You can also see when a scrape happened the last time, how long it took, and if there were any errors.
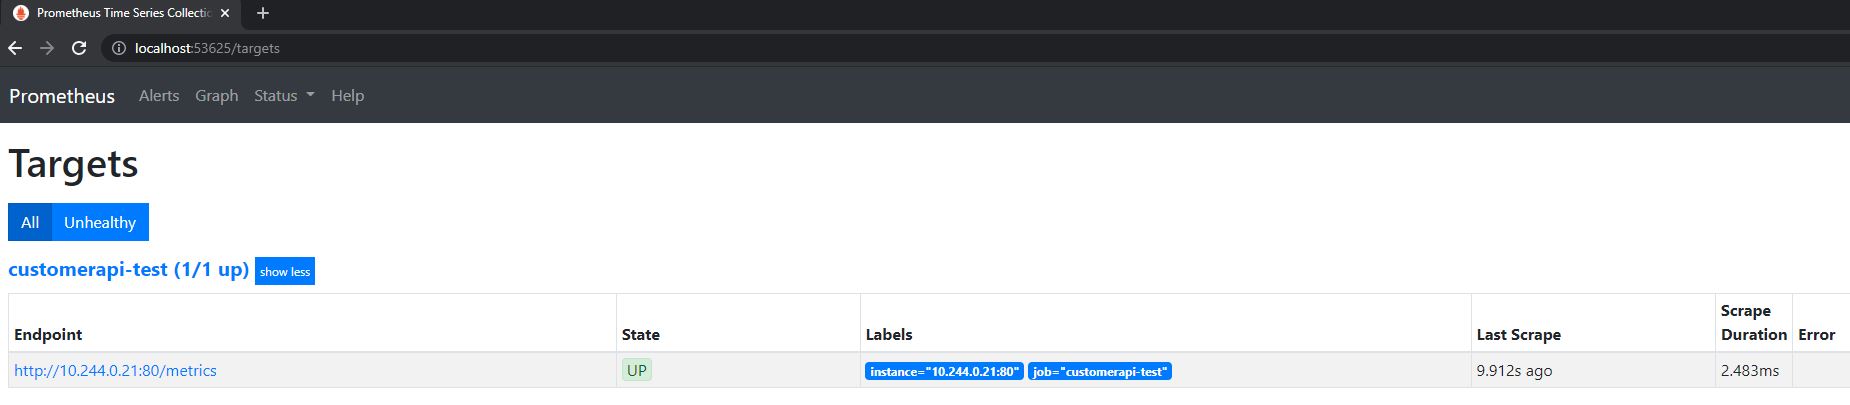
Inspect the Prometheus Scrap Targets
Query Prometheus Data in Grafana
If you don’t know how to access Grafana, see Collect and Query your Kubernetes Cluster Logs with Grafana Loki for information on how to configure the redirect and how to read the admin password from the Kubernetes secret.
In Grafana, click on the round (compass?) symbol on the left and select Explore to open the query editor.

Open the Grafana Query Editor
Make sure that you select Prometheus as the data source on top of the page and then you can create your first queries. Click on metrics to get an overview of a lot of the built-in commands and get familiar with the functionality of the queries. A useful metric is a histogram where you can display a certain quantile, for example, the 95% quantile. You can see a query of the 95% quantile of the request duration. You can see that the requests were fast but at around 18:30 the request duration spiked to up to 100 seconds. This clearly indicates that there was a problem.
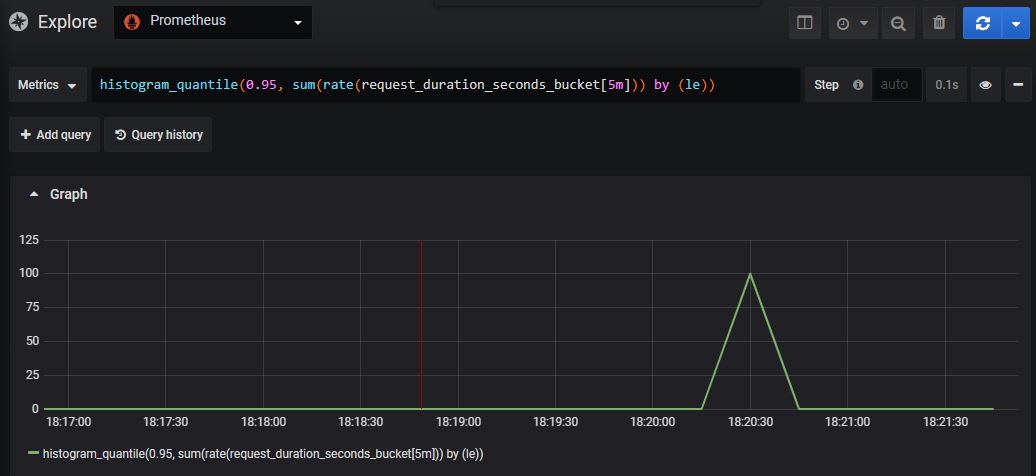
Create a Histogram
The functionality of PromQL is way too vast for this post today but you can find example in the Prometheus documentation.
Import Grafana Dashboards
Grafana allows you to import dashboards from the community which is a great starting point. You can find a list of all the dashboards on https://grafana.com/grafana/dashboards.
Once you found a dashboard you like, for example the Kuberets Cluster (Prometheus) dashboard, copy its id.
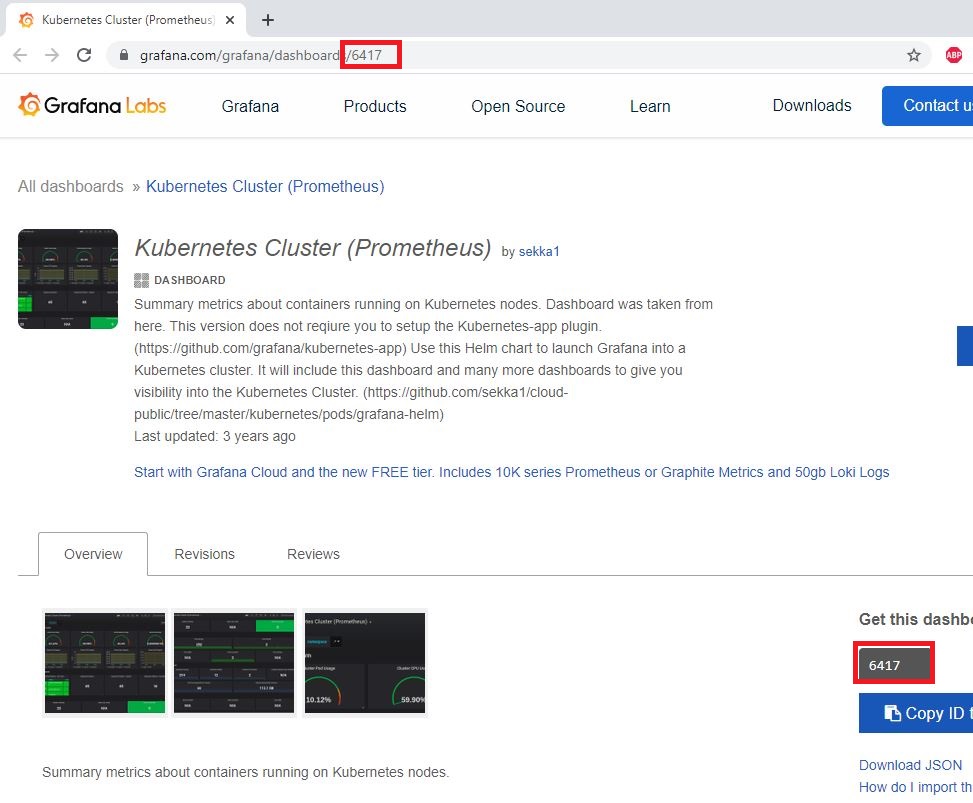
Copy the id of the Dashboard
Next, click on the + button on the left of your Grafana GUI and select Import.
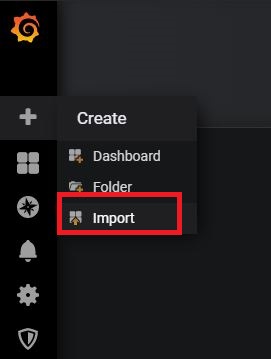
Import a Grafana Dashboard
On the import page of the dashboard, provide a name (or leave the default one) and select your Prometheus instance from the dropdown. Then click on Import and the dashboard gets imported.
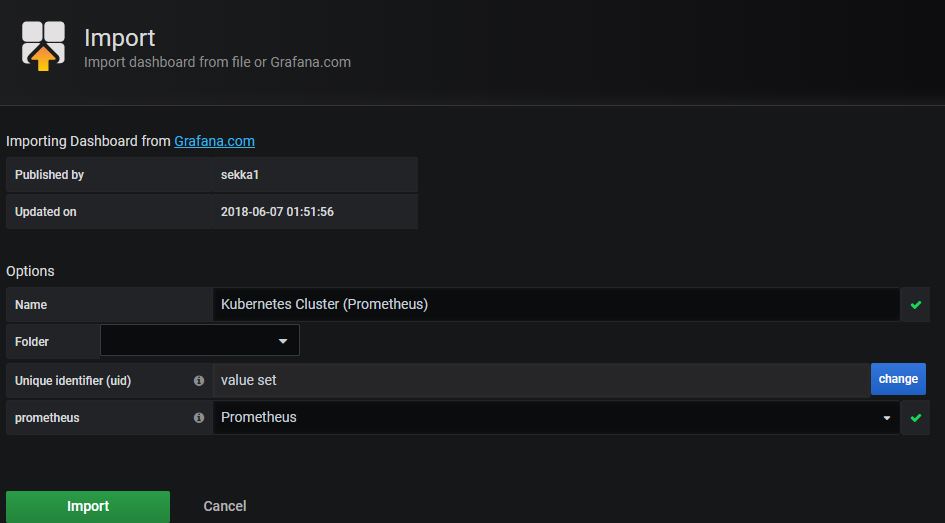
Configure the Dashboard Import
After the dashboard is imported, it gets immediately displayed and gives you an overview of your cluster health, the cluster’s pods, and containers, and much more.
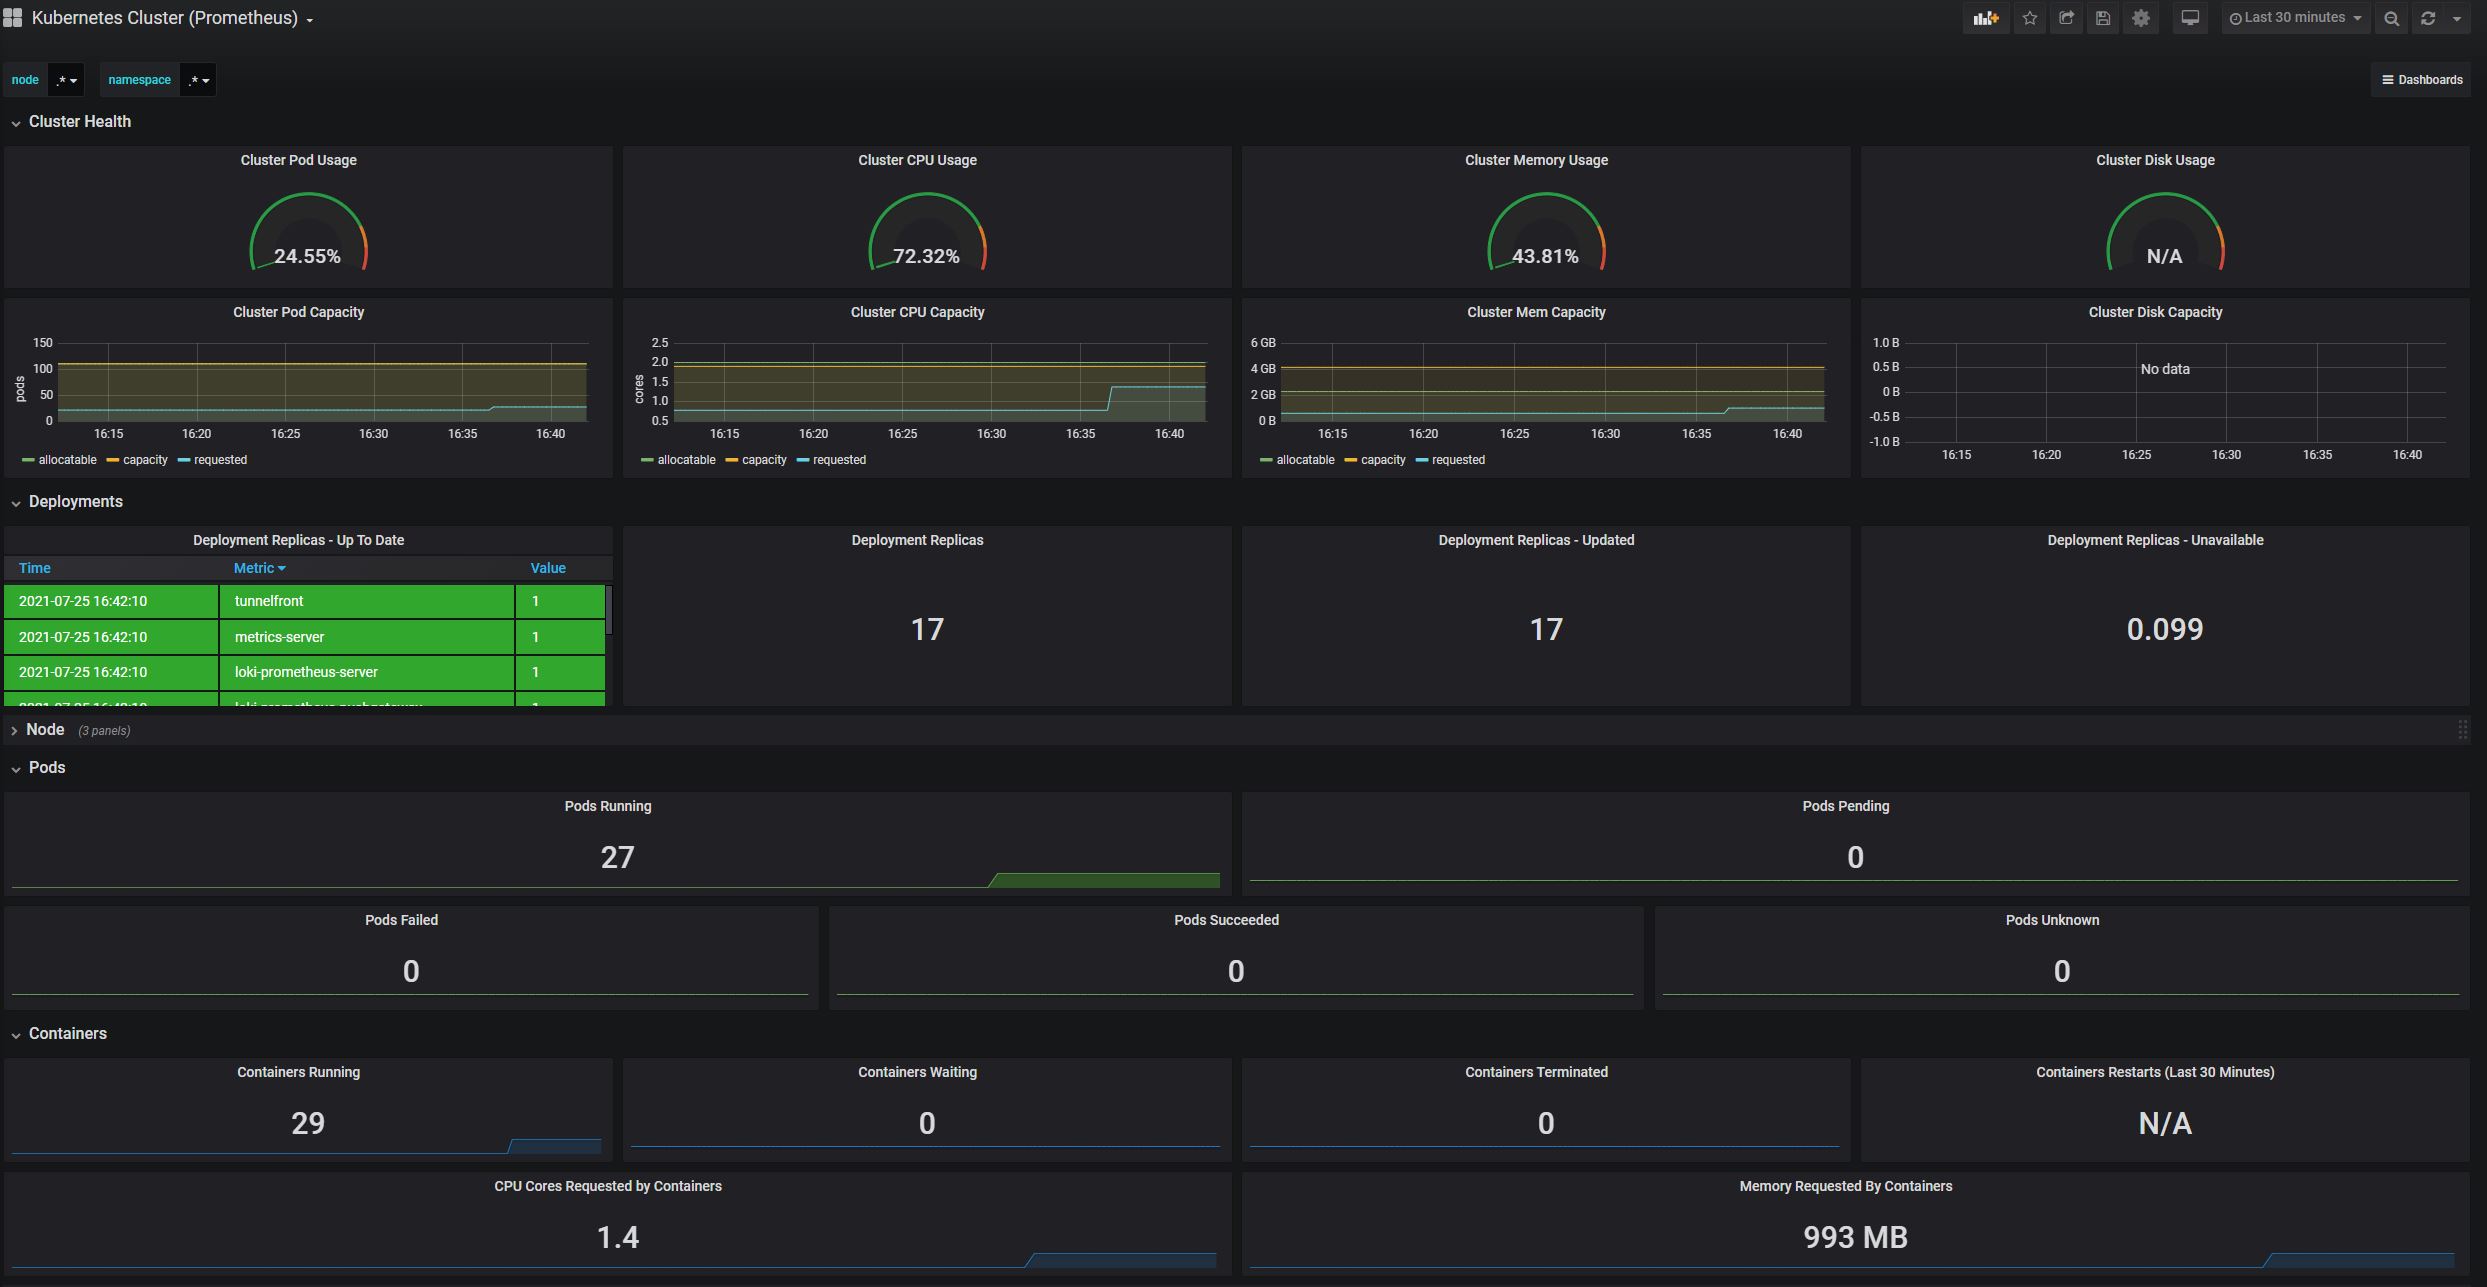
The Dashboard gives an Overview of the Kubernetes Cluster
The dashboard already gives you useful information but you can easily edit or remove its components and also can take a look at the definition of each component. This can help you when you try to create your own dashboards.
Community dashboards are a good way to get started but you will always have to create your own dashboards to fulfill your requirements.
Create your own Grafana Dashboard with Data from Prometheus
To create your own Grafana dashboard, click on the + button on the left side of the Grafana GUI and then select Add Query.

Start creating a new Grafana Dashboard
Select Prometheus as your data source on the next screen and enter a query. My query creates a histogram for the 99% quantile for the request duration in seconds over the last 10 minutes.
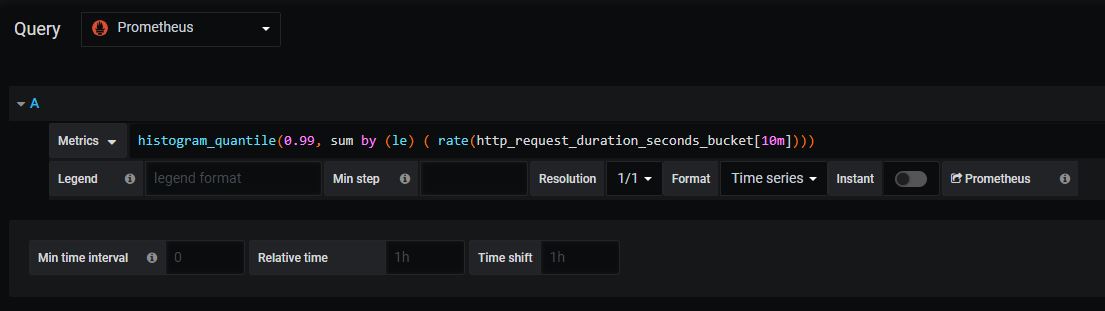
Create a Histogram Query
The Visualization tab allows you to configure the looks of your dashboard. I added points to the graph and added a label and unit for the left y-axis. Additionally, I added the min, max, and average values of the query to the legend on the bottom left of the graph.
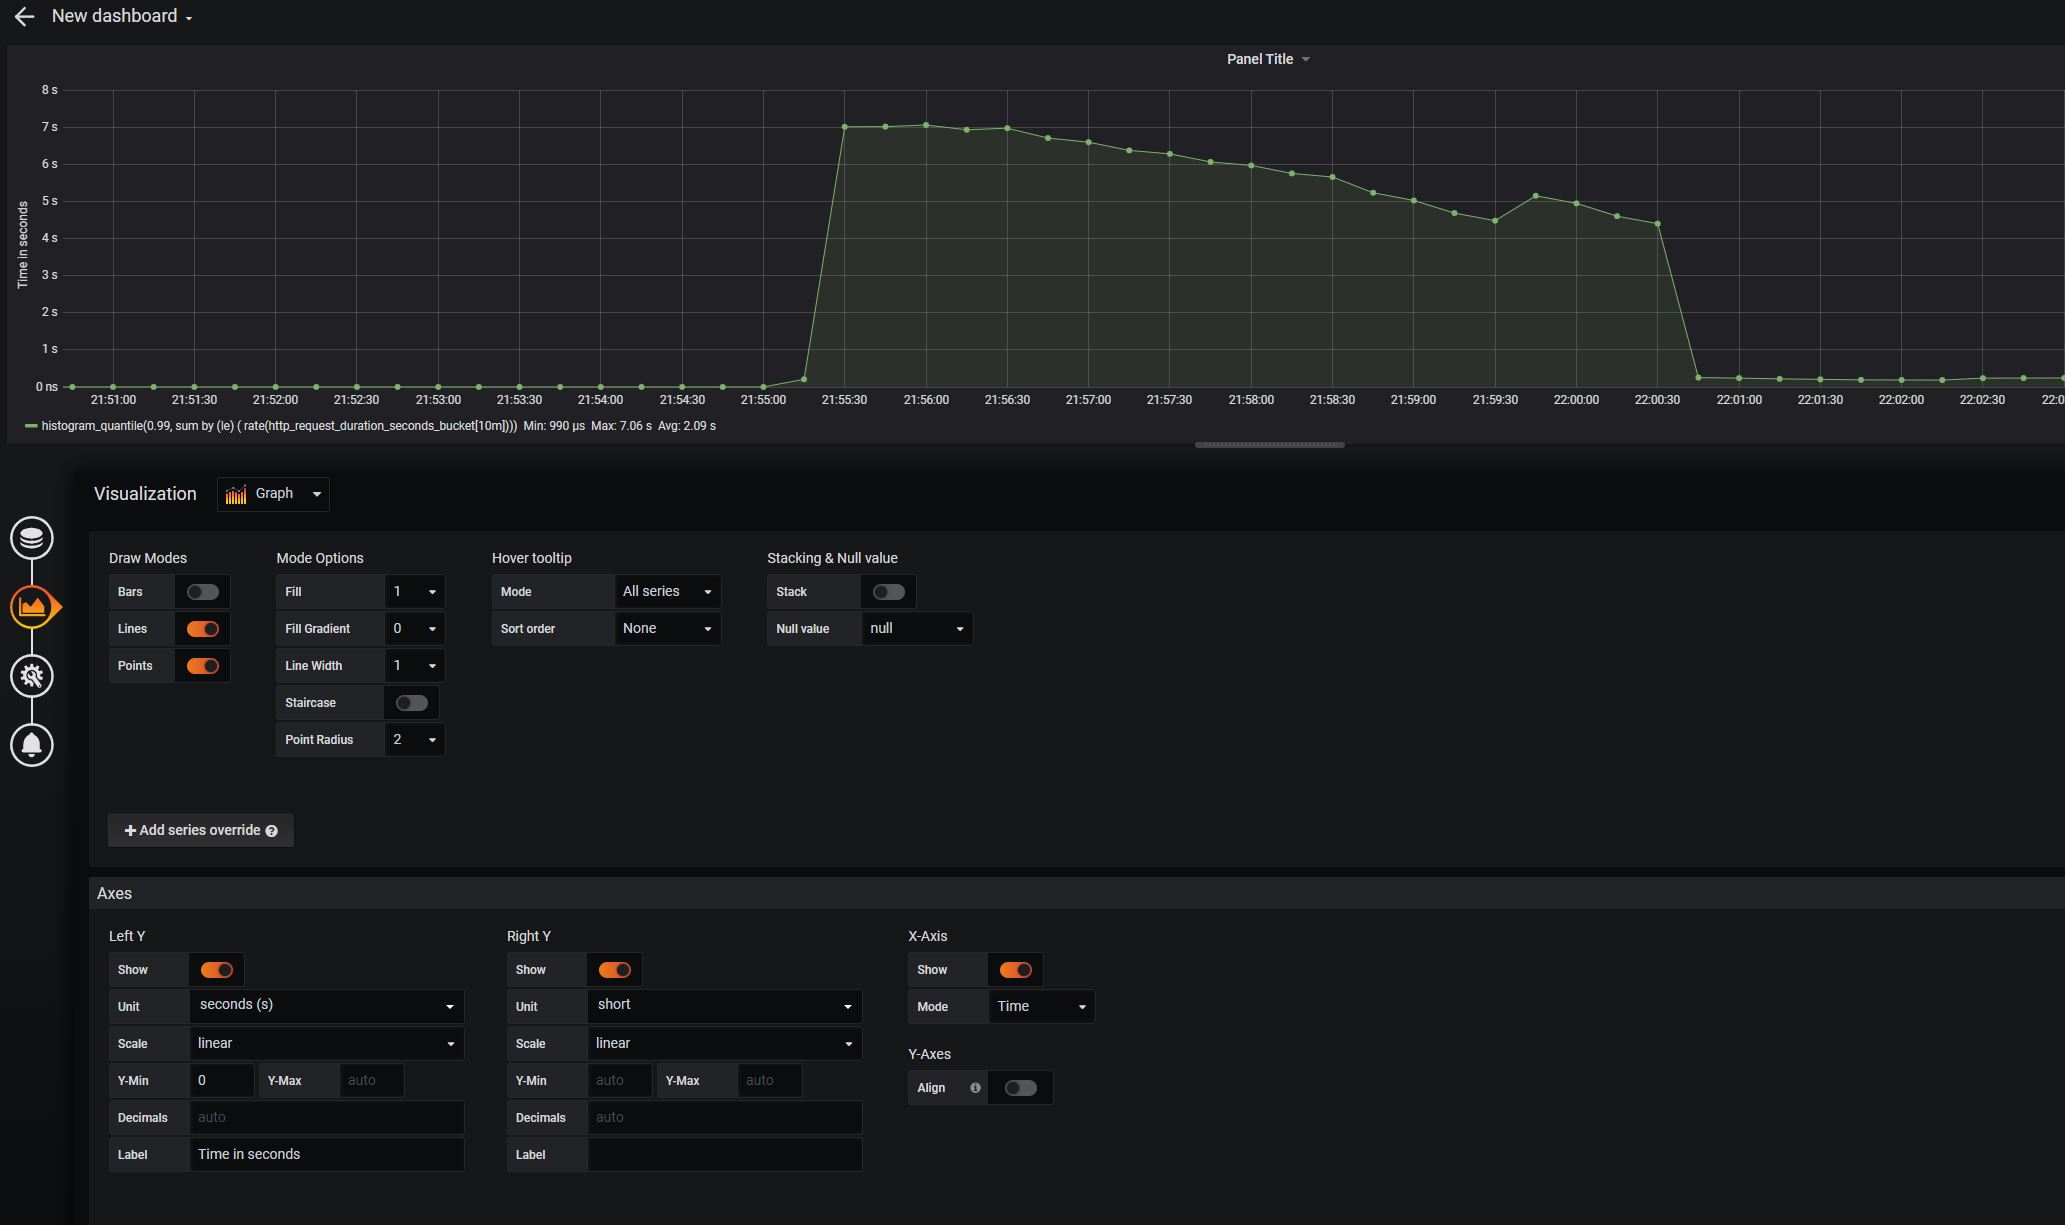
Configure the Visualization of the Dashboard
There is a wide variety of options to customize your dashboard. Some are more and some are less useful like the following one.

Use a Gauge to display your data
On the next page, provide a title for the dashboard. You should always name all the axis and dashboards so everyone can easily see what this dashboard displays.

Add a Title
Lastly, click on the Save button and give your dashboard a name.
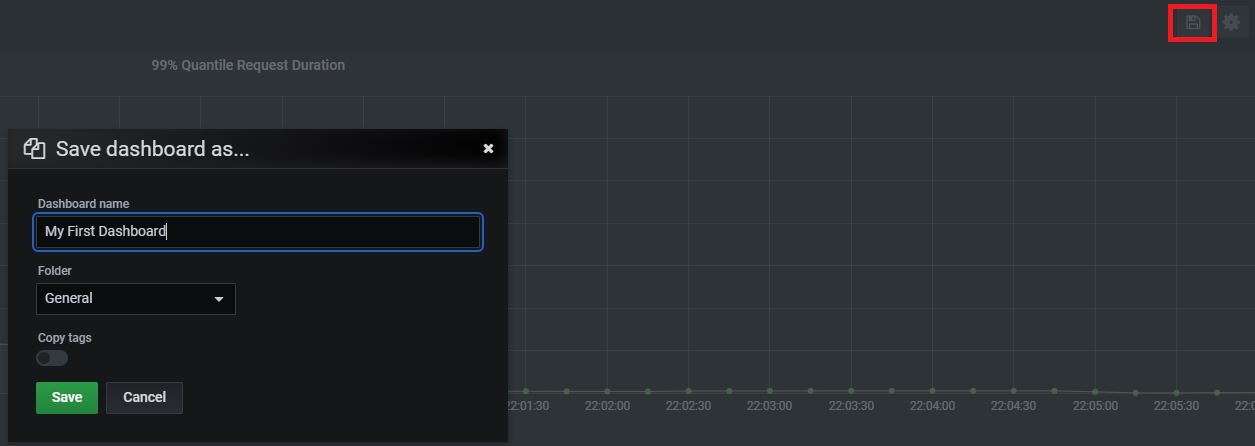
Save your first Grafana Dashboard
Congratulation, you created your first dashboard. You can add as many components as you want to this dashboard in the future. If you take a look at the one we have, you can immediately see that there is something not right with the service.
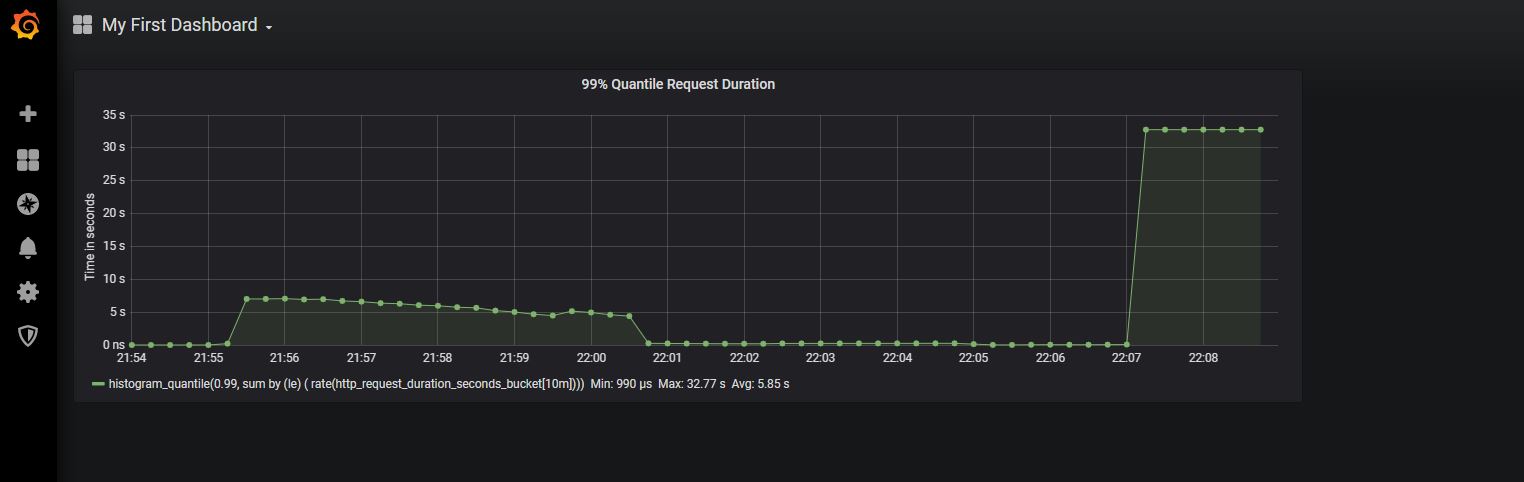
Something is wrong with the monitored Service
Between 21:55 and 22:01 the request time was around 5 - 7 seconds which does not look good compared to the very low request time the service usually has. At 22:07 the request duration spikes to around 35 seconds which is definitely not good and shows that something is massively wrong.
Conclusion
Grafana combined with Prometheus is a powerful tool to visualize your metrics from each component of your Kubernetes cluster and even from single deployments or pods. This post showed how to add new targets to the Prometheus scrap configuration and how to import and create your own dashboards to display the request duration.
You can find the code of the demo on GitHub.
This post is part of “Microservice Series - From Zero to Hero”.
Comments powered by Disqus.