
Azure Arc allows you to project your on-premises Kubernetes cluster into Azure. Doing so enables you to manage the cluster from Azure with tools such as Azure Monitor or Cloud Defender.
Today, I want to show you how to install the Container Insights Extension which enables you to monitor your pods and nodes from the on-premise cluster in Azure.
This post is part of “Azure Arc Series - Manage an on-premises Kubernetes Cluster with Azure Arc”.
Install the Azure Monitor Extension
Using Azure Monitor with your on-premises Kubernetes cluster is surprisingly easy. All you have to do is to execute the following Azure CLI command on the Master node of your cluster:
The parameter of the command should be self-explanatory. The most interesting one is probably the –name parameter. This Azure CLI command creates the namespace you defined with the –name parameter but it is empty at first glance. It creates an Azure Monitor Agent Deployment and ReplicaSet in the kube-system namespace though. The newly created namespace contains a config map and some secrets to ensure a safe communication with Azure.

Display the Azure Monitor Agent pods
Additionally, the –name parameter defines the name of the extension which you can find in the Azure Portal in the Extensions pane.
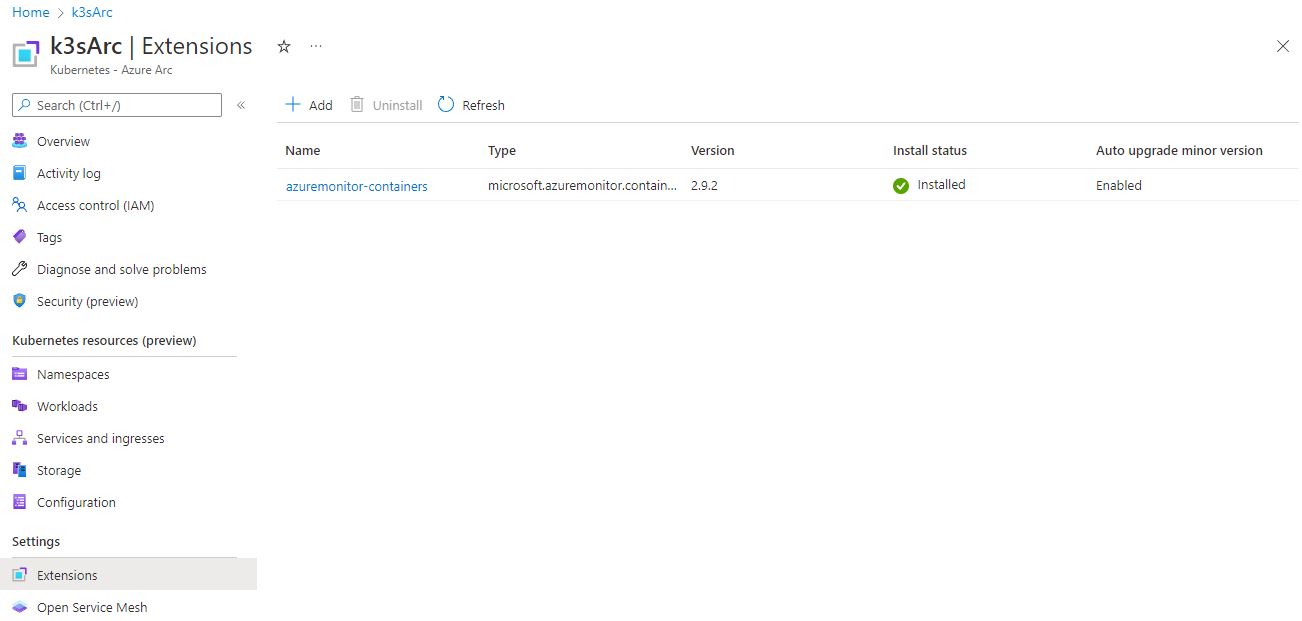
The Azure Monitor Extension in the Azure Portal
The Azure CLI command automatically creates a new Log Analytics Workspace for the metrics and logs of the extensions. You can also use an existing Work Analytics Workspace. Use the following command to assign the Log Analytics Workspace Id to a variable and then use this variable for the Azure Monitor extension:
You can also display the installed extensions using the Azure CLI with the following command:
Create Dashboards in the Azure Portal
After you have installed the extension, it collects metric information and sends them to Azure. This allows you to use Azure Monitor the same way as you would use it with Azure VMs. Open Azure Arc in the Azure Portal and navigate to the Insights pane. There you can see various dashboards already. You can change what you want to display and also switch the scope, for example, from the Cluster scope to the Container scope. Additionally, you can set various filters such as a time range.
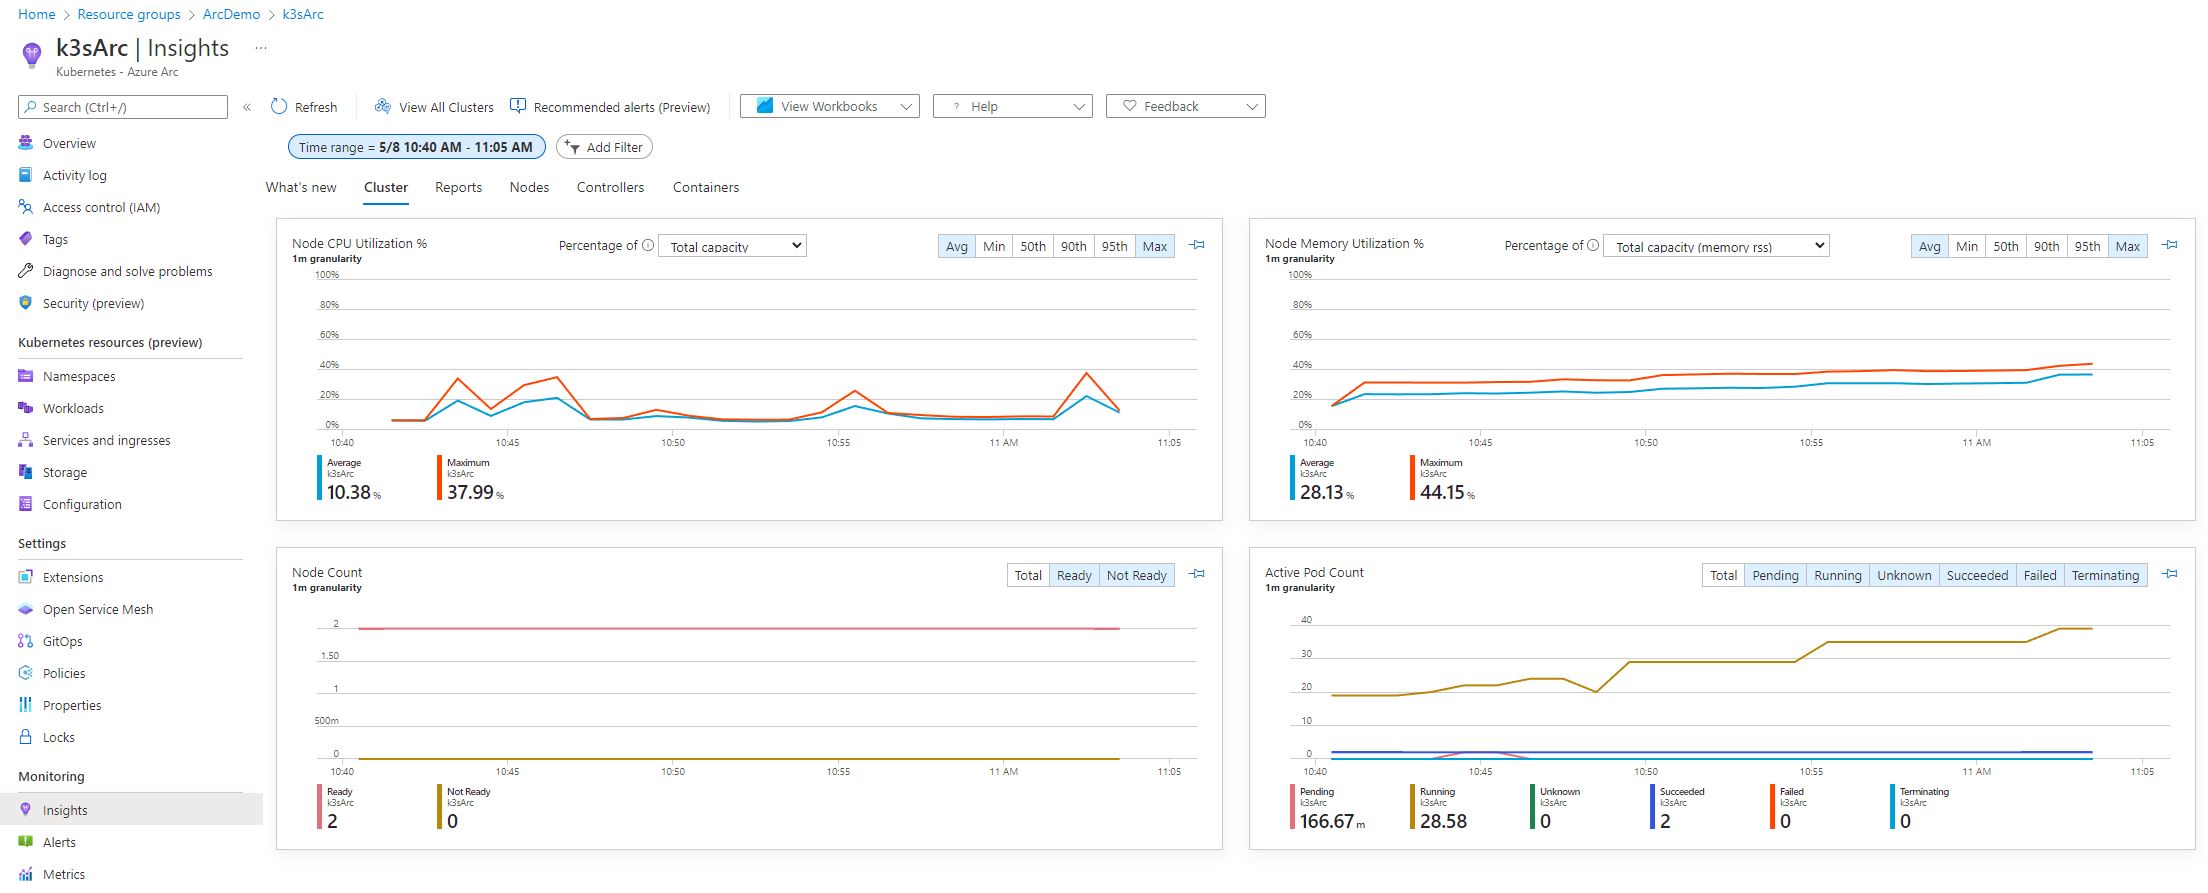
Display various dashboards in the Azure Portal
For even more insight into your cluster or pods, open the Metrics pane in Azure Arc. There you can create charts and display useful information. The following screenshot shows a chart that displays the pod count and the used CPU percentage of all nodes.

Create custom charts to display information
Another neat feature of Azure Monitor is Alerting. Go to the Alerting pane and there you can create alerts based on custom rules. For example, you could send an email to an administrator if the CPU usage of the cluster is greater than 80% over 5 minutes.
Conclusion
Monitoring your on-premise Cluster is as easy as it could be with Azure Arc. All you need is a single Azure CLI command to install the Azure Monitor extension. This extension collects various metrics and sends them to Azure. There, you can create dashboards or alerts. All this works the same way as when using Azure Monitor with Azure VMs.
This post is part of “Azure Arc Series - Manage an on-premises Kubernetes Cluster with Azure Arc”.
Comments powered by Disqus.