

A decision tree is a classification algorithm used to predict the outcome of an event with given attributes. For example can I play ball when the outlook is sunny, the temperature hot, the humidity high and the wind weak. This post will give an overview on how the algorithm works. For more detailed information please see the later named source. I will focus on the C# implementation.
Theory behind the decision tree
The decision tree is a supervised algorithm. This means that the algorithm needs to learn with training data first. After this training phase, the algorithm creates the decision tree and can predict with this tree the outcome of a query. Every leaf is a result and every none leaf is a decision node. If all results of an attribute have the same value, add this result to the decision node. You can find a great explanation of the ID3 algorithm here.
Training data
As first step you need a set of training data.
| Day | Outlook | Temperature | Humidity | Wind | Play ball |
|---|---|---|---|---|---|
| D1 | Sunny | Hot | High | Weak | No |
| D2 | Sunny | Hot | High | Strong | No |
| D3 | Overcast | Hot | High | Weak | Yes |
| D4 | Rain | Mild | High | Weak | Yes |
| D5 | Rain | Cool | Normal | Weak | Yes |
| D6 | Rain | Cool | Normal | Strong | No |
| D7 | Overcast | Cool | Normal | Strong | Yes |
| D8 | Sunny | Mild | High | Weak | No |
| D9 | Sunny | Cool | Normal | Weak | Yes |
| D10 | Rain | Mild | Normal | Weak | Yes |
| D11 | Sunny | Mild | Normal | Strong | Yes |
| D12 | Overcast | Mild | High | Strong | Yes |
| D13 | Overcast | Hot | Normal | Weak | Yes |
| D14 | Rain | Mild | High | Strong | No |
Applying the algorithm
To apply the ID3 follow the following 4 steps:
- To figure out which attribute to choose, the algorithm has to calculate the entropy. The entropy indicates how ordered the elements are where an entropy of 1 means totally randomly and 0 means perfectly classified. With this entropy, the algorithm can calculate the information gain of the attribute, where the higher the better. After the information gain is calculated for every attribute, the attribute with the highest information gain will be placed as the root node of the decision tree. With the sample data from above, Outlook will be placed as the root node.
- The next step is to repeat this process but without Outlook and only where the value of Outlook is Sunny. This will place Humidity as next decision node. With Sunny and Humidity High all result nodes are No, therefore No will be placed as a leaf node. Sunny and Normal Humidity has only Yes as result. Therefore Yes will be placed as leaf and this side of the tree is finished.
- After finishing the Sunny side the next attribute is Overcast. Every result with Overcast is Yes. Therefore Yes will be placed as leaf and this route is finished too.
- The last side Rain will be processed as in 1. but only with Wind and Temperature where Outlook is Rain.
Figure 1 shows the result of the finished decision tree.
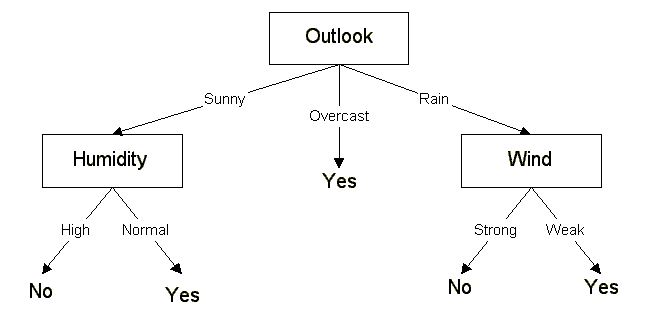
Figure 1: Decision Tree [Source](https://www.cise.ufl.edu/~ddd/cap6635/Fall-97/Short-papers/2.htm)
The result shows that not all attributes have to be considered. In this example, the attribute Temperature does not appear in the tree.
Getting a result for a query
After the decision tree is created, getting a result for a query is pretty straightforward. If the user enters the following attributes in his query: Sunny, Mild, Normal, Strong then the algorithm only has to follow the tree and return the leafs node value. In this example, the route leads from Outlook over Sunny to Humidity and over Normal to Yes. The result of this query, therefore, is Yes.
Optimizing the algorithm
There are several ways to optimize the algorithm like pruning, subtree raising or subtree replacement. My implementation does neither of that and therefore I won’t go into these topics here.
Implementation
When I googled for an implementation of a decision tree I could only find one solution in Spanish which didn’t work. My implementation is not perfect but it should run without any problems and helped me to understand how the ID3 algorithm works.
The implementation has the following Features:
- Creating a decision tree
- Importing training data from a CSV file
- Exporting training data into a CSV file
- Manually entered training data
- Printing the decision tree (as far as possible in the console)
- Finding a result for a query and printing the used route through the tree
Training phase
The probably most interesting part of the application is the Tree class. This class contains all the logic for creating the tree, finding a result and printing the tree. The first method called is Learn. This method is responsible for creating the tree. GetRoodNode finds the root node applying the ID3 algorithm. Then the algorithm checks whether the edge of the previously found node leads to a leaf. This is checked in the CheckIfIsLeaf method. If the edge leads to a leaf, the leaf is added. If the edge doesn’t lead to a leaf then CreateSmallerTable is called. This method removes the column of the previously found node from the dataset. With this smaller dataset, Learn is called. This recursion is repeated until every edge points to a leaf.
Finding the result
The CalculateResult method is called to find the outcome of the entered query. This method is pretty straightforward. It takes the root node and then used the entered edge to reach the next node. This process is repeated until a leaf is found. If no edge can be found for the input an error message is displayed. The edges and node names are separated by — and –>. This is to improve the readability of the result when printed to the console.
Output
Due to the nature of the console, printing the tree results into displaying every possible route through the tree. To improve the readability nodes are written in upper case and edges in lower case. The root node is printed in Magenta, normal decision nodes in Cyan and leafs in yellow. Edges are printed in yellow.
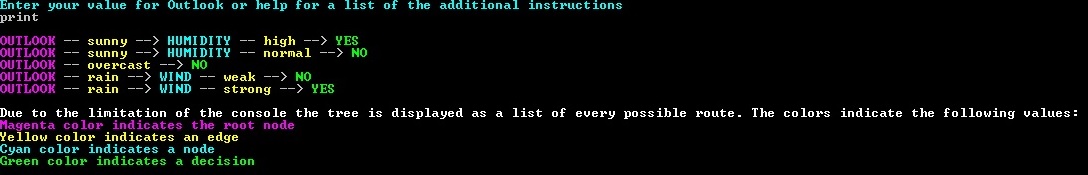
Figure 2: Printing the decision tree
If a result for a query is found, the found route will be printed with the same principle as just explained.
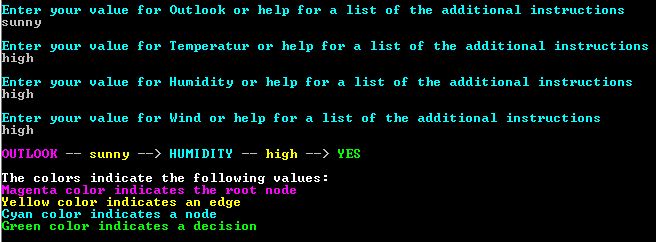
Figure 3: Printed result of a query
Limitation
As already mentioned, my implementation doesn’t do any form of optimization.
Another limitation is that the last column is the result column and should only contain two different values. If these values are not Yes or No the coloring of the leafs doesn’t work properly.
The last Limitation is the console. Due to its nature, printing a proper tree is (especially dynamically with different inputs) is a pretty tricky task. Since the focus is on the implementation of the algorithm, I didn’t put too much time into the visualization.
Further documentation and the source code
You can find the source code on GitHub. You need at least Visual Studio 2015 to run the solution. Inside the solution folder, you can find a CSV file with test data. For a more comprehensive description of my implementation and related paper to the ID3 see my documentation which you can find here.
Comments powered by Disqus.